



Welcome to The Trendline, the FiftyPlusOne.news weekly polling roundup. Subscribe to get it delivered straight to your inbox and get bundled access to our polling website.
Hello poll lovers! For this week’s final Trendline before the election, we pulled out all the crosstabs we’ve been tracking all year. We’ve pored over polling averages by geography, education, age, race, gender, and party to get a feel for the patterns and changes we’ve seen in the electorate this cycle.1 (If you want even more, we’ve added updating crosstabs to our generic ballot tracker for paying subscribers.) Because that was… a lot, there’s no nuggets for you this week, though you can always go back to last week’s Oops, All Nuggets! Trendline if you’re jonesing for poll snippets. So without further ado, let’s dive in!
Geography
When we last checked in on voters by geography, we noted that Democrats appeared to be gaining more with rural voters than urban or suburban voters. That trend has continued in the final months, with Republicans now holding just a 12 percentage point advantage over Democrats with rural voters. At the same time, we’ve seen additional gains among suburban voters for Democrats, who now hold a 12 percentage point advantage over Republicans among suburbanites, a demographic group they have not won in the generic U.S. House results in at least a decade, according to exit polls.
According to the latest National Suburban Poll (Sept. 18 - 25, 2026), suburban voters have come to look a lot more like urban voters in recent years. For example, in their previous surveys, mostly conducted in the Obama era, there was typically a double digit gap between the percent of urban and suburban voters who approved of Obama’s job performance; that gap for Trump today is just 2 percentage points. We see similar changes on the generic ballot in the Obama-era surveys compared to today.
And it’s not just on presidential approval or Congress where suburban voters appear to be changing. They’ve grown more pro-choice, for example: 64 percent of suburban voters in the latest survey say abortion should be legal in all or most cases, more than the 62 percent of urban voters who agree, a reversal from all the previous Suburban Polls. Suburban voters now are more likely than in the past to say climate change is a very or somewhat serious problem; 73 percent say so today, compared to 66 percent in 2016, while the numbers for urban voters have barely budged from 74 to 76. And pessimism among both groups has grown on issues like the quality of public schools, crime, and poor maintenance of public properties.
In addition to Republican struggles with suburban voters, rural voters have continued their shift toward Democrats, now appearing 20 points more Democratic on the margin than they did in 2024 House races. And in some parts of the country, like Texas, rural turnout is lagging behind other geographies. Of course, early vote isn’t the whole story; these voters still can turn out on Election Day, but given the state of the polls, that may not help Republicans much.
There could also be some error in the kinds of Republicans that polls are reaching, which may be contributing to a bit of a mirage among rural voters. Our colleague Elliott Morris noted that in his surveys, there were more Republicans responding to polls than expected in bluer parts of the country, so it’s possible that the numbers among rural voters are subject to some sampling error. Adjusting for that fact, the overall generic ballot only changes by about 1 percent, so the topline might not be much different, but outcomes in states with significant rural populations could be impacted more if this sort of sampling error is widespread (and those voters actually turn out).
Education
Currently, Democrats are winning college-educated voters by about 19 points in our average of generic ballot crosstabs, a 3 point shift to the left since the beginning of the year. Non-college-educated voters have shifted even more than that — at the beginning of the year, these voters favored Republicans by about 2 points, but now prefer Democrats by the same margin.
These generic ballot shifts are actually a bit smaller than the ~5 point shift in the overall generic ballot since January, but they correspond with big drops in presidential approval among each group. According to our averages, net approval of Trump is now 9 points lower among non-college-educated voters than it was in January, and 10 points lower among those with a college education. Even among white Americans without a college degree — typically one of the most reliably Republican demographics — 57 percent say their opinion of Trump has changed for the worse over the last two years, according to polling from PRRI (Aug. 20 - Sept. 7, 2026).
Democrats’ 19-point advantage among college-educated voters would be the largest for the party since 2018, when they won the group by 20 points, according to exit polls. But more notably, Democrats’ current 2-point advantage among non-college-educated voters would be the first time in over ten years that the party has won the demographic — Democrats’ high-water mark this decade was in 2018, when non-college-educated voters split evenly between the two parties.
Democrats’ larger advantage among college-educated voters will almost certainly serve them well; college-educated voters are likely to make up a bigger share of the electorate than 2024 (typical for a midterm election), and they’re also thinking about the election much more than their non-college-educated counterparts, indicating greater enthusiasm to vote. But even though non-college-educated voters turn out at lower rates in midterms than college-educated voters, they still make up a larger share of the electorate, meaning a shift left among the demographic could swing a greater number of raw votes.
Paid subscribers to 50+1 get access to premium analysis, plus sortable tables and complete data access on our polling website. If you want to follow the 2026 cycle with the best data at your fingertips, become a paid subscriber.
Age
In March, we noted that voters under the age of 30 had shifted quickly toward Democrats on the generic ballot, with the generic ballot margin for Democrats increasing by 24 points among the group since Trump’s inauguration, far more than any other age group. That trend has continued; the margin for Democrats among voters under 30 now stands at 30 points, compared to 22 back in March. But that drift toward Democrats has also materialized among Millennials: Voters between 30 and 44 have drifted 8 to 9 points more to the left than they were in March, now favoring Democrats by around a 16-point margin.
And it’s not just young voters favoring Democrats this time around. In every age demographic we track, Democrats lead (albeit slightly). This is a significant shift from past election cycles, where Democrats haven’t led among voters over the age of 45 in a single year. Of course, it’s worth noting that these groups change over time; voters that are currently under the age of 30 mostly were too young to vote in 2016, and those under the age of 30 in 2016 are now mostly in the 30-44 bracket.
However, the big lead for Democrats among young Americans probably shouldn’t be read as a sign that these voters are in the Democratic camp forever. According to the latest Harvard Youth Poll (Sept. 30 - Oct. 7, 2026), more voters under the age of 30 identify as independent (42 percent) than as members of either party (33 percent identify as Democrats, and 22 percent as Republicans). These voters seem to be especially pessimistic about the state of the country, with just 9 percent saying that America is heading in the right direction, compared to around 30 percent nationally, according to Decision Desk HQ. In polling from Navigator Research (Oct. 1 - 5, 2026), while roughly a quarter of Trump voters regret their choice, more than a third of Gen Z Trump voters do. And in the Harvard Youth Poll, slightly more young likely voters who say they plan to vote for Democrats say their vote is more against the Republicans (51 percent) than in favor of the Democrats (49 percent).
Race
In September, we wrote about how Democrats seemed to be performing around their 2020 levels with Hispanic voters, a huge shift left compared to the party’s performance in 2024. That shift has remained, with Democrats currently winning Hispanic voters by 24 points in our average of generic ballot polls. That could have major implications for districts across the southern U.S., particularly in Texas and Florida, where five or more heavily Hispanic districts redrawn this year to favor the GOP could actually end up going to Democrats.
White and Black voters have both moved toward Democrats by about 5 points since the beginning of the year, roughly matching the movement in the overall generic ballot. But movement in the polls isn’t the only indication that these demographics are shifting.
Early-vote data has shown a surge in turnout among Hispanic voters, particularly infrequent voters. According to data compiled by our friends at VoteHub, the share of low-propensity Hispanic voters turning out in Texas increased every day of the first week of early vote. And according to an analysis by Tom Bonier of TargetSmart, in 96 percent of counties across the country, the Hispanic share of the early vote is larger than it was at this same point in 2022. Bonier found that in every state that has begun voting, Democratic Hispanic turnout is surpassing Republican Hispanic turnout.
We’ve also seen increased turnout among Black voters in some states; in Georgia, which is host to competitive governor and U.S. Senate races, Black voters are making up a greater share of the early voting electorate than they did in 2024, while white voters are comprising a similarly smaller share of the early voting electorate. We’ve also seen Black turnout surge in other southern states, potentially in part due to backlash over the Supreme Court’s decision to overturn major portions of the Voting Rights Act.
However, early voting data is just that — early. There’s plenty of time for these trends to shift or change, but what we’re seeing so far aligns with the trends we’ve observed in the polling averages. And voting patterns change over time; Pew Research Center (Sept. 28 - Oct. 4, 2026) found that among voters who plan to support a Democrat, just 15 percent plan to vote by mail, compared to 22 percent in 2022, so in states with significant early vote-by-mail, we may not be seeing the full picture when we compare to previous cycles.
There’s another key racial demographic that could swing important elections this year that isn’t captured in most national polling: Arab Americans. These voters will play a crucial role in deciding Michigan’s competitive U.S. Senate and governor races in a state where Arab Americans make up 4 percent of the population, the largest in the country. A new poll from Change Research for the New Arc Collective (Oct. 16 - 23, 2026) shows Arab and Muslim Michiganders favoring Democratic U.S. Senate candidate Abdul El-Sayed by a 59-point margin, 77-18. If that holds, it would be a gargantuan swing from 2024, when a national John Zogby Strategies poll for the Arab American Institute (Sept. 9 - 20, 2024) showed Arab Americans almost evenly split between the presidential candidates. No doubt a good portion of this shift can be attributed to El-Sayed’s status as an Arab and Muslim American himself, but probably not all 59 points of it. Even among what is a relatively small segment of the population, such a large swing could make the difference in a close race.
Gender
Our current estimates for men and women show women favoring Democrats on the generic ballot by about 16 percentage points, while men favor Democrats by a scant 0.17 percentage points. This is a significant shift; men have not favored Democrats in the House in years; in presidential elections, men have voted in favor of the Democrat just twice since 1980, according to the Rutgers University Center for American Women and Politics.
In addition to men possibly swinging to Democrats this year, the gap between men’s and women’s votes is smaller than usual. In each of the last five election cycles, the difference between men’s and women’s net votes for Democrats has been at least 20 points. In polls this year, though, the gender gap is around 16 points. If we compare to recent presidential cycles, according to Rutgers, this would be the smallest gender gap since 2008.
Of course, this story is somewhat tangled up with age. According to a Cygnal poll (Sept. 15 - 18, 2026) among men aged 18 to 30, while Trump narrowly carried young men in 2024, they now favor Democrats slightly, 44 to 41, a lead that grows to 17 points among those most determined to vote. Donald Trump’s favorability rating among young men is underwater by nearly 18 points in the poll, closer to what we see among voters overall.
Party
As we observed back in May, one of the defining features of this year’s election has been the unprecedentedly high party loyalty among Democrats, at least in the Trump era. The latest polling shows this pattern has held up as we come to the close of the campaign; Democrats remain especially likely to vote for a candidate from their own party, while Republicans lag. And unlike in previous midterm cycles, Republicans have not seen members of their own party “come home” in the final stretch of the campaign: In the two previous midterms, every party grew their party loyalty from the beginning to the end of the campaign, but this year, the percent of Republicans saying they plan to vote for a member of their own party has actually fallen a tad, from 92 percent in May 2025 to 91 percent now.
This sorry performance among members of their own party reflects a deeper discontent among Republicans that we also see in other polling. For example, in early October Ipsos/Reuters reported that the percentage of Republicans who strongly approve of the president had fallen from 70 percent at the beginning of his term to just 30 percent, and his overall approval with his own base had dropped from 91 percent to 73 percent. Even among members of his own party, Trump’s approval rating on the cost of living was underwater in their late September survey.
Of course, elections aren’t won just with the party base. Both sides will need to persuade independents to their side to have a chance at winning next week. But on that score, Democrats seem to have the upper hand.
In our polling average, Democrats enjoy a 19 percentage point lead among independents ahead of November’s election. If that holds, it will be the largest lead for the party in the Trump era, even larger than 2018’s 16-point victory among the group, according to exit polls. But like with young voters, it would be a mistake to think that independents would stick with Democrats long-term — there’s a reason these voters aren’t members of a political party.
In the latest New York Times/Siena University poll (Oct. 12 - 19, 2026), just 23 percent of independent likely voters say they are satisfied with the Democratic Party, and a similar 25 percent say they are satisfied with the Republican Party. Fifty percent of these voters say their midterm vote is for a candidate to provide a check on Trump, while just 13 percent say it’s to support Trump. And on all issues tested, independent voters said that Democrats would do a better job than Republicans, and on the most critical issues for this year’s election, the gap between the parties was at least 20 points.
With independents and Republicans both souring on the Republican Party this year, Democrats appear to be in good shape. The question is whether the sour mood among Republicans and independents translates to Democratic votes, or even not voting, rather than Republicans and Republican-leaners finally coming home in these last few days.
Polling averages update
All numbers are as of 12:00 PM Eastern on Oct. 30, 2026.
2026 U.S. House generic ballot
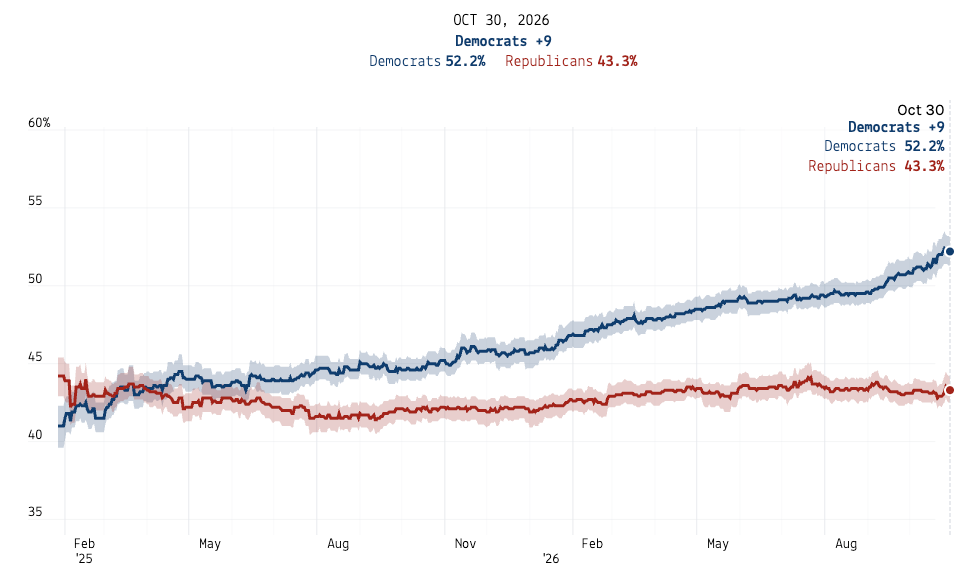
The Democratic margin in the 2026 U.S. House generic ballot remained steady this week, with Democrats ahead of Republicans by 9 percentage points. Currently, 52.2 percent of likely voters say they plan to vote for a Democrat in November, compared to 52 percent last week, while the percent that say they plan to vote for a Republican rose slightly from 43.1 percent last week to 43.3 percent this week.
Trump’s job approval
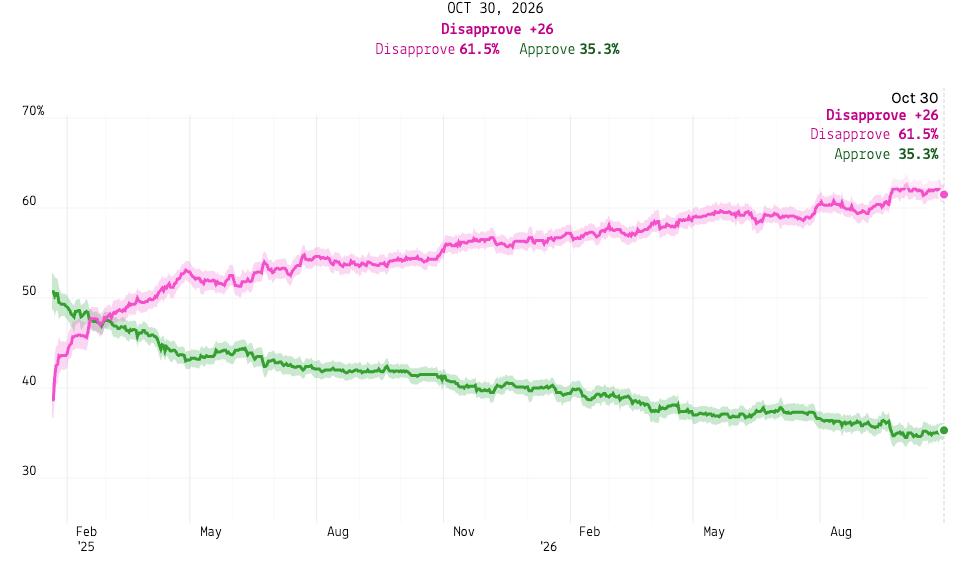
President Trump’s net approval rating among U.S. adults rose a point this week to -26 percentage points. Overall, 61.5 percent of Americans disapprove of the president’s job performance, while 35.3 percent approve.
Paid subscribers to 50+1 get access to premium analysis, plus sortable tables and complete data access on our polling website. If you want to follow the 2026 cycle with the best data at your fingertips, become a paid subscriber.
All data in this article is as of 12:00 a.m. on Friday, Oct. 30. All charts include data within 500 days of the election. The methodology used to calculate the polling averages can be found at the bottom of this article. We have slightly refined the methodology to be more reactive to individual polls and less constrained by the overall topline.