

How different demographic groups are moving on the generic ballot
The Democrats are polling well with all voters, but especially independents and rural ones


With the first few primaries under our belt, we are officially in the swing of the 2026 midterm election season here at FiftyPlusOne. With that, we are kicking off what will become a semi-regular check-in on how the two parties are doing in U.S. House generic ballot polls. We’ll take a look at the topline — the single best predictor we have of which party will win the House of Representative in November — but also do some digging under the hood to see where key demographic groups are today, how that compares to 2024, and how they’re evolving as the campaign unfolds.
National polling and historical trends
As of 4:00 PM Eastern on Wednesday, March 11, 2026, the FiftyPlusOne generic ballot polling average shows Democrats ahead of Republicans by 4.9 percentage points.
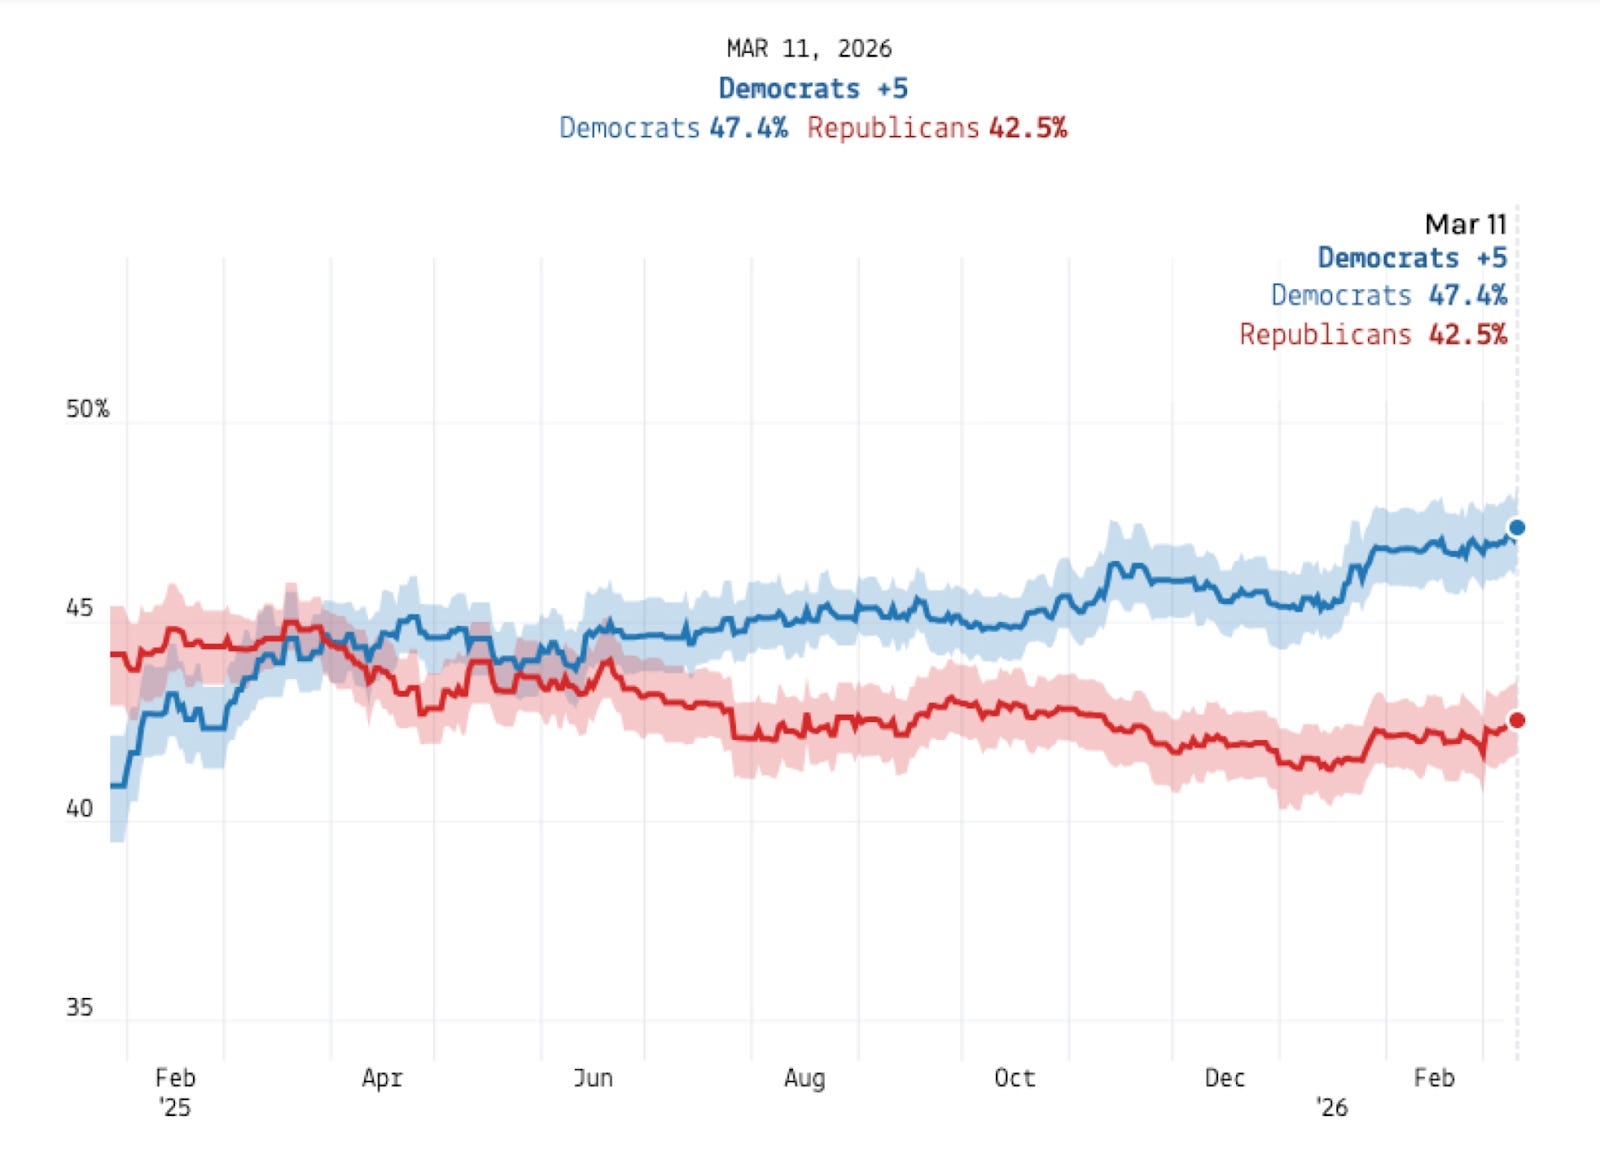
This marks a significant improvement for the Democrats since our tracking began in late January 2025. Then, Republicans were leading in our aggregate by 3.3 percentage points (they won the 2024 U.S. House popular vote by about 2 points). This sort of movement is to be expected; generally speaking, the president’s party tends to lose ground on the generic ballot over time. Between the fall preceding a midterm election and the election itself, the president’s party loses, on average, 3.5 percentage points on the generic ballot (and loses about 6 points if you exclude the 2002 election, for which normal dynamics were disrupted because of the September 11, 2001 terror attacks). If that average were true this year, it suggests that the Democrats should expect to see additional gains between now and November of several points; polling in the fall showed Democrats ahead by around 3 percentage points, so there is still room for further increase.
That said, there are a few exceptions to the rule, so the Democrats shouldn’t be too complacent. As mentioned, a post-9/11 rally around the flag effect buoyed the Republican party to victory in the 2002 midterms, and in 1990, when George H.W. Bush was president, the Democrats had an unusually good midterm cycle, holding an early lead in the polls of 10 points, which fell to “just” 8 in November. So while there’s a lot of time between now and November for either party to pick up ground, usually in this situation, the out-party — Democrats — is the one who does.
To better understand where there might be opportunities or pitfalls for either party, we gathered up all the crosstabs to get a feel for how key demographic groups are leaning at this point in the race. (Note: all data referenced in this article is as of 4:00 PM Eastern on Wednesday, March 11, 2026.)
Age
One of the critical demographic groups that propelled President Donald Trump to victory in 2024 was younger voters. According to the Pew Research Center analysis of voters in the 2024 presidential election, Trump earned 39 percent of the vote among voters aged 18-29, the best performance of his three presidential bids.
According to polling this cycle, the Republicans started off in a decent position with young voters. In late January and early February 2025, crosstabs showed a fairly close race among young voters, with a margin of less than 4 points in either direction.
But young voters quickly moved away from Republicans as Trump’s term unfolded; by the end of March 2025, Democrats led among young voters by around 17 points, a lead that has grown to around 22 points today.
Now, some of the big jumps in the polling among young voters may be driven by a relatively small number of polls in the early days of the race. But we do not see a similar bounce in Democratic vote margin among other age cohorts, for which we have the same number of polls. While all age cohorts considered here have moved toward Democrats on the generic ballot over time, the movement among young voters has been by far the most significant.
Now, we do find that among younger demographics, more voters are likely to say they are undecided in polls — but it’s clear from this data that the improvement for Democrats is not just undecided voters getting off the fence. The Republican share of the vote among young voters has fallen from the low 40s at the beginning of the trend (consistent with Trump’s 2024 performance) to the low 30s today (more in line with the 2020 and 2018 elections). And the number of undecided 18-to-29-year-olds hasn’t meaningfully changed; around 14 percent did not choose a candidate in the early part of the trend, whereas today it’s around 12 percent. So we can be reasonably sure Republicans’ weakened position is not just from voters refusing to tell pollsters how they feel, but them actually changing their minds over the course of Trump’s presidency.1
However, those undecided voters could be hiding a potential upside for Republicans. In the latest Harvard Youth Poll conducted in Fall 2025, 22 percent of 18-29 year old voters that voted for Trump in 2024 were undecided about their midterm vote choice, while just 11 percent of Harris voters said the same. And young people that did not have a college degree (and weren’t pursuing one) were also the most likely group of young voters to say they were undecided: 41 percent of non-college young people said they were undecided, compared to 27 percent of college students and 24 percent of college graduates. According to Pew, Trump won voters without a college degree by 14 points in 2024 — so there may be room for Republicans to improve among younger voters.
Race
When it comes to race, there’s some good news and bad news for both parties.
As with all demographic groups, there has been movement over time towards Democrats among all racial cohorts. And unlike among age cohorts, that movement has been fairly uniform. White, Black, and Hispanic voters, for example, have all shifted 6-7 points towards Democrats, on the margin, since the trend began.2
However, there’s some warning signs for Democrats under the hood. While Black voters have shifted towards Democrats since the trend began, our polling average shows 16 percent of Black voters still plan to vote for the Republican candidate in their local House seat in November. This is fairly similar to the 15 percent of Black voters that Pew estimates voted for Trump in 2024, nearly double his vote share among Black voters in 2020. So even as Democrats are making improvements overall, there may still be some work for them to win back support among this crucial demographic.
On the other hand, Republicans seem to have lost ground compared to 2024 among Hispanic voters.3 Pew estimates that 48 percent of Hispanics voted for Trump in 2024, with him losing the demographic by just 3 percentage points, compared to a loss by 25 percentage points in 2020. But in the latest data, Democrats lead among Hispanic voters by around 16 percentage points. And while 11 percent of Hispanic voters do not indicate they plan to vote for either a Republican or Democrat in November, even if you allocated all those undecided voters to the Republicans (highly unlikely!), the party would still be a point shy of matching Trump’s 2024 performance.
And if you are skeptical of crosstabs as a way to measure movement among demographic groups, elections themselves bear this out. Results of both special and general elections held throughout 2025 and 2026 broadly also suggest Republicans have lost ground with Hispanics relative to Trump’s performance in 2024.
Independents
Among independent voters, we’ve also seen a substantial shift toward Democrats since our generic ballot polling average began. Today, our aggregate of polls shows Democrats winning 42% of independent voters, compared to 28% for Republicans. That compares to 36% for Democrats and 30% for Republicans in January 2025.
However, there’s a significant number of independent voters that do not indicate support for either the Democratic or Republican candidates. Depending on the poll, these voters may be undecided, or may tell pollsters that they don’t plan to vote in November at all. Because few pollsters are currently screening for likely voters, it can be hard to tell how things are really going with the political middle.
To make things even more complicated, different pollsters define “independent” in different ways: some pollsters may push respondents to say whether they lean toward one party or the other, and others may not. How so-called “true” or “pure” independents differ from those that lean toward a party can’t be teased out from the dataset we currently have.
Even given those caveats, it’s hard to see the roughly 14-point lead for Democrats among independents as anything but good news for the party. According to Pew, Trump was dead even with independents in 2024 (their version does not include those that lean toward a party), so that swing probably indicates real movement among these voters.
Geography
When it comes to geography, we see a familiar pattern: urban voters support Democrats, rural voters support Republicans, and suburban voters are somewhere in between.
As with racial demographics, there are some concerning elements for both parties here. First, Republicans are significantly underperforming with rural voters compared to recent elections. As of now, about 38 percent of rural voters plan to vote for a Democrat in November, per our estimates. This is better than any presidential candidate has done with rural voters in at least a decade: according to Pew, Harris earned just 29 percent among rural voters in 2024, and both Biden and Clinton had 34 percent vote share with rural voters. And while improvements among rural voters may not help Democrats that much in the House, where gerrymandering ensures more favorable demographics for both parties in individual races, several potentially competitive Senate seats are in states with significant rural populations, such as Ohio, Iowa, and Texas.
On the other hand, Republicans seem to be holding on to their 2020 and 2024 gains among urban voters. In 2016, Pew estimated that 24 percent of urban voters chose Trump over Clinton, which grew to 32 percent for Trump in 2020 and 33 percent in 2024. In our polling averages today, 36 percent of urban voters plan to vote for the Republican candidate in November. If this holds to November, Democrats could be facing a challenge in key Senate races in states with substantial urban populations, such as Texas.
Overall, the generic ballot polling so far shows Democrats on their way to a decent showing in November. And under the hood, they’ve improved their margins with every demographic group we looked at (even the ones not discussed here) since the beginning of 2025. However, Republicans should be feeling good about retaining some of their recent gains among traditionally Democratic groups, like urban voters and Black voters, which may help offset losses among other demographics.
Democrats are up 5 points overall, per our generic ballot average today. The trend most responsible for this swing (7 points relative to the 2024 election) is the party’s strong showing among political independents (+14 at time of publication). If that holds, the party should win the majority of seats in the U.S. House of Representatives quite easily. But we just have polls, not a crystal ball — so that “if” is still just that, an “if.”
Methodology
To estimate demographic subgroup trends for the generic congressional ballot, we use an exponentially weighted moving average (EWMA) that adjusts polls for their sample size, recency, subgroup noise, and movement in the national generic ballot since each poll was conducted.
We calculate this average in five steps. For any given day, we look at the polls conducted for a subgroup on or before that day, and do the following:
First, each poll’s Democratic and Republican vote shares are de-trended by subtracting the corresponding national topline estimate on the poll’s end date, isolating each subgroup’s deviation (aka residual) from the national environment on that day. If the national average for the Democrats is 45% and the subgroup is 50%, for example, we record the subgroup residual as +5.
Second, we calculate a EWMA with a decay rate of 0.96 (roughly a 17-day half-life) on the de-trended values from all polls for this subgroup. Then we add back the national topline to produce trend-adjusted subgroup estimates. This ensures our average accounts both for movement in the national trend and a subgroup’s overall lean toward one party.
Third, we compute house effects for each pollster in each subgroup based on how much their polls differ from the average. Each firm’s house effect is equal to the average difference between their results and the trendline-adjusted national average on the day the pollster released their results. We then shrink the house effect toward zero to account for noisy residuals, via the formula `adjusted = raw_effect * n / (n + 5)`, where n = the number of polls from a pollster among that subgroup. So a pollster with 1 poll keeps 1/6 (~17%) of their estimated bias. With 5 polls it’s 50%, with 10 polls it’s 67%, etc. This ensures that when we have relatively few results from a given pollster, we aren’t overconfident in their house effects.
Fourth, we subtract each pollster’s house effect from their results, and then calculate a new aggregate estimate that adjusts for house effects and movement in the national generic ballot average. We do this by repeating steps 1 and 2 above, but using the house-effect-adjusted poll results instead of the raw results. That gives us a final EWMA for each party in demographic group!
The final step is to blend this EWMA with a model-based prior prediction of each party’s average that is used to smooth out phantom swings in the average that result from noisy data. The modeled prior for each subgroup is simply the national topline plus that group’s average historical offset from the national topline — giving us a stable estimate of where the group “should” be on any given day based on the overall national environment.
The amount of weight assigned to the modeled prior vs EWMA depends on the cumulative information provided by the polls for each subgroup: groups with many recent, large-sample polls that consistently agree with each other will be driven almost entirely by the EWMA, while groups with few, small, or noisy polls will lean heavily on the modeled prior. This effective weight also incorporates a reliability score for each subgroup, estimated by comparing the variance of that group’s de-trended poll results to the median variance across all groups. Subgroups whose polls are noisy and inconsistent accumulate effective weight more slowly, keeping them closer to the modeled prior even when poll counts are similar to more stable groups.
The final average we report for each group is thus equal to an average of the EWMA for that group and the modeled estimate, using the following formulas:
w = eff_weight / (eff_weight + 20)
final = w * EWMA + (1 - w) * model_prior`
Where eff_weight is the cumulative sum of decayed poll weights (each poll’s sqrt(sample_size) * reliability, decayed by 0.96 per day since the poll was conducted). So at eff_weight = 20, it’s a 50/50 blend. At eff_weight = 60, it’s 75% EWMA. A brand new group with one small poll might have eff_weight around 5, giving ~20% EWMA and ~80% prior.
After averaging for each group, overlapping age ranges (e.g., 18–24, 25–34, 18–44) are collapsed into four standard buckets (18–29, 30–44, 45–64, 65+) using the approximate share of the population in each group. (While they are not shown here, we do the same thing for education subgroups. Several overlapping categories are collapsed into four tiers based on the proportion of the population that is shared between the original and target groups: high school or less, some college, bachelor’s, or postgraduate. A separate binary college/no-college category is separated out from the more detailed education variables. We will dive into education and race-by-education breaks in a future crosstabs deep dive!)
Footnotes
Depending on the survey, voters that do not choose a candidate may have told pollsters they were undecided, not voting, voting for a third party candidate, or something else. All of those options are included here.
Due to small sample sizes and inconsistencies in how different pollsters report racial groups other than white, Black, and Hispanic/Latino, we are unable to calculate a reliable trend for any other racial demographics.
Some pollsters publish a crosstab among “Latino” voters, and other among “Hispanic” voters; we include both in our average among Hispanic voters.