



Welcome to The Trendline, the FiftyPlusOne.news weekly polling roundup. Subscribe to get it delivered straight to your inbox and get bundled access to our polling website.
For decades, Republicans have built their congressional strength on support from rural voters, racking up huge margins in some of the most sparsely populated areas of the country. That advantage isn’t going away any time soon, but an average of recent generic ballot polling shows that Democrats are making significant inroads with these voters, posing another challenge to the GOP’s aim of retaining their congressional majorities.
The shifts among urban and suburban voters this cycle compared to recent cycles are roughly in line with what we would expect, given that the overall generic ballot has moved about 8 points toward Democrats since President Donald Trump took office. While the party isn’t quite at the massive 33-point margin among urban voters they had in 2018’s blue wave election, they’ve still significantly improved their numbers since the last midterm in 2022, and currently hold an estimated 27-point advantage among city-dwellers in an average of generic ballot polls.1 Democrats have particularly gained support from urban voters over the last year, with these voters shifting leftward by nearly 11 points since last August, while the general public has shifted only 3 points leftward.
Democrats are also performing quite well with suburban voters, who comprise about half of the electorate and who, at least since 2016, usually lean slightly Republican. Democrats currently hold a 6-point advantage in the suburbs, which would be the first lead for the party among these voters in over a decade if it holds. A solid Democratic performance here would boost the party’s chances of winning key congressional races stretching from the Rust Belt all the way to Florida.
But the most interesting numbers can be found among a demographic Democrats have struggled with for years. While rural voters have long voted heavily Republican, recent data indicates they could be much less favorable to the GOP this year. Since Trump’s inauguration last January, our average of generic ballot polls shows rural voters shifting 13 points toward Democrats, solidly outpacing movement among both urban and suburban voters. Most of that change came early on in Trump’s second term, with rural voters shifting 10 points leftward in the first year of the administration. The GOP’s current 13-point polling advantage is right in line with their 14-point lead in 2018, when Democrats scored massive wins across the country.
Take these shifts with a healthy amount of uncertainty, though. Between Trump’s inauguration and mid-April, every geographical crosstab in our database came from just three pollsters: Echelon Insights, Cygnal, and McLaughlin & Associates. This doesn’t mean the data is wrong — Echelon and Cygnal, for instance, are reputable firms that produce high-quality data. But an average based on data from just three pollsters will generally be less accurate than one that comprises a larger selection of polls. Starting around April 15, 2025, many more pollsters began to release generic ballot polls with urbanicity crosstabs and the average becomes a bit steadier, though it still points to a strong Democratic overperformance, particularly among rural voters.
It’s impossible to know for sure what exactly is behind this larger shift among rural voters. Many farmers have been hit hard by tariffs and inflation, as well as uncertainty from an unfinished and convoluted farm bill that could all be contributing to frustration with the party in power. But issue polling can give us some more concrete clues.
Take the most recent Beacon Research/Shaw & Co. Research poll for Fox News (Jul. 17 - 20, 2026), for instance, where 51 percent of rural respondents said they feel betrayed by politicians from their own party, more than the share of urban or suburban respondents who said the same. And 68 percent of rural voters said it was more important to bring in new people to the government than to keep people with experience, while just 31 percent said the opposite. That matches the number of suburban voters who agreed, and far exceeds the 53 percent of urban voters who said it was more important to bring new people in. When asked how closely tied voters thought each party was to elite interests, 68 percent of rural voters said the GOP was cozy with elites, while only 56 percent said the same of Democrats.
In isolation, these could just be seen as general anti-government sentiments rather than a backlash specifically against the GOP. But when taken together, it’s easier to see how an anti-establishment rural electorate might put up stronger-than-normal resistance to Republicans this cycle. That could matter greatly in November — GOP backsliding in rural areas could imperil their chances in close states with large rural populations like Iowa and Alaska, which have competitive Senate and House seats on the line. And if rural voters continue to trend more Democratic through the general election, seats like MT-01 and CO-03 that were previously considered to be a bit of a reach for Democrats might start to look more like toss-ups.
It’s important to note, though, that while these numbers are interesting, crosstab data can be really noisy sometimes. Take, for instance, a Cygnal poll in April that showed Democrats down 30 points among rural voters, followed by a John Zogby Strategies poll two weeks later that showed Democrats down just 9 points. That’s why we take an average, which helps to smooth out these differences. It certainly doesn’t mean we should disregard the data, or that these polls have nothing useful to tell us, just that we should be extra careful when drawing conclusions from them. Democrats are doing well in other metrics, like special elections in rural areas, that also point to a strong midterm showing for the party. But the best way to consume polling data is to understand the inherent uncertainty that comes with it, and these crosstabs are no exception.
Other polling nuggets
Karoline Leavitt is stepping down as White House press secretary, citing a desire to spend more time with her young children (Leavitt became the first press secretary in U.S. history to give birth while holding the job). According to a YouGov poll (Aug. 17, 2026), she’s seen as the best press secretary to serve Trump, with 19 percent saying she’s been Trump’s best press secretary, and no other spokesperson getting more than 5 percent. This is especially true among Republicans: 40 percent say Leavitt has been Trump’s best press secretary. Two-thirds of Democrats say none of them have been the best, and none of Trump’s five press secretaries got more than 3 percent among Democrats. Still, across the political spectrum, Americans approve of her decision to leave the job, with 52 percent approving and just 8 percent disapproving. Approval is especially strong among Democrats, at 60 percent, while 53 percent of Republicans and 44 percent of independents approve of her choice.
In the latest release from the University of Maryland Program for Public Consultation, in polls conducted nationally and across competitive states and districts in May and June, a majority of voters in every jurisdiction polled agreed on three out of four mechanisms to reduce the Social Security budget shortfall, while views on the last mechanism were more mixed. After being told that the policies were aimed at reducing the shortfall, voters were asked if they favored or opposed them. The most preferred policy was to subject income over $400,000 to payroll taxes (currently, all income over $185,000 is exempt from Social Security taxes), which was supported by at least 70 percent of respondents in every state and district polled, as well as 79 percent nationally. Reducing benefits to the top 20 percent of lifetime earners was supported by 65 percent nationally, and at least 56 percent in each state and district. These two proposals, garnering the most support out of the four, would both target high-earners to try to shore up the Social Security trust.
Proposals that would hit more universally are slightly less popular. Increasing payroll taxes from 6.2 to 6.5 percent was supported by 62 percent nationally, and at least 56 percent in each state and district polled. Increasing the retirement age from 67 to 68, however, was more controversial. Fifty-six percent of voters nationally said they favored the proposal, but swing states and districts are mixed. The proposal was under 50 percent support in four geographies, and at 50 percent in another three. Democrats seem especially skeptical, with eight jurisdictions showing Democratic support under 50 percent, compared with just three showing Republican support under 50 percent.A significant majority of Americans say that corruption influences the decisions made by the federal government, according to a new Ipsos/Reuters poll (Aug. 14 - 17, 2026). A whopping 74 percent said that corruption influences the federal government “quite a bit” or “a great deal,” including 81 percent of Democrats, 70 percent of independents, and 71 percent of Republicans. But the closer you get to home, the less people think corruption plays a role. Asked how much corruption influences decisions made by their own state government, 57 percent said quite a bit or a great deal, and when it comes to their local governments, just 44 percent said the same.
Among a variety of popular sports and fitness activities, running is by far the most popular outdoor sport. In an Ipsos poll (Jun. 26 - 28, 2026) released this week, 38 percent of Americans said they had gone running or jogging for exercise in the last year, far more than the second most popular activity, basketball, which 14 percent said they had played in the last year. Young Americans were especially likely to say they went running, with 51 percent of those under the age of 35 saying they had, compared to 49 percent of those aged 35-49, 29 percent of those aged 50-64, and 17 percent of those over the age of 65. The only sport that had more participants among those aged 65 and older than those under the age of 35 was golf, with 12 percent of the oldest respondents saying they had played golf in the last year, compared to 11 percent of the youngest.
Polling averages update
All numbers are as of 1:00 PM Eastern on Aug. 21, 2026.
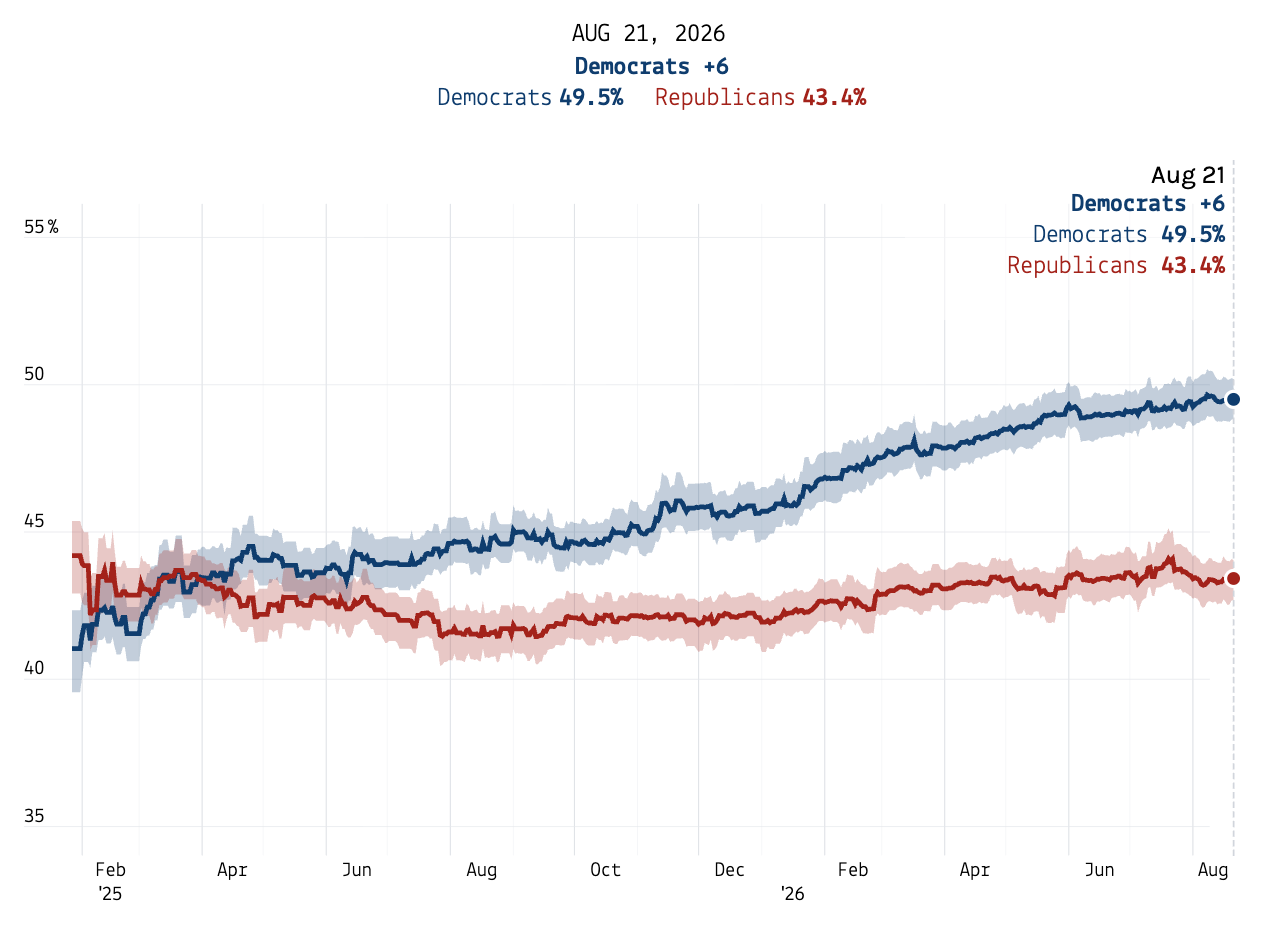
2026 U.S. House generic ballot
The Democratic margin in the 2026 U.S. House generic ballot stayed steady at Democrats +6 this week. We saw almost no change in the past week, with both Democrats and Republicans moving up by 0.1 percentage point.
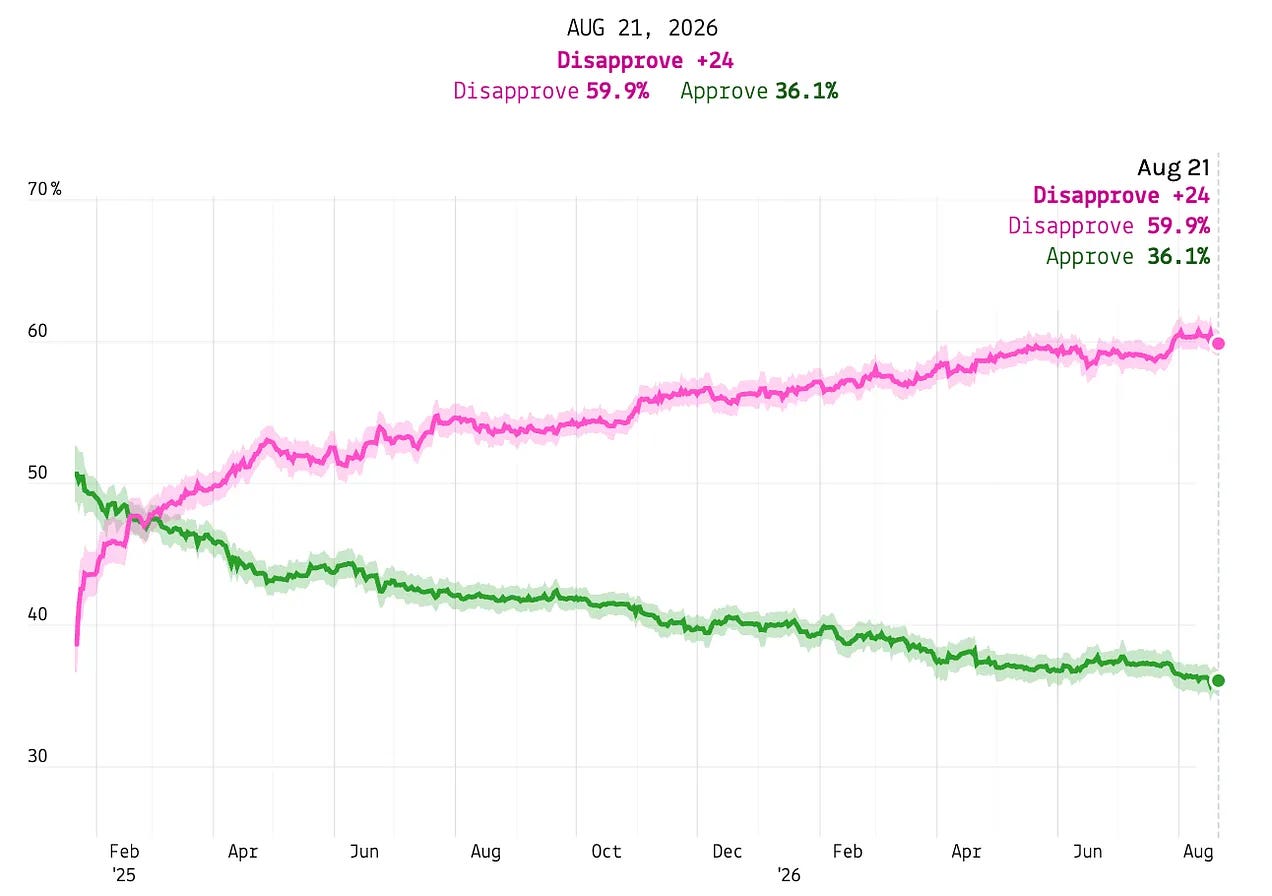
Trump’s job approval
President Trump’s approval rating among U.S. adults remained underwater by 24 percentage points this week. His disapproval fell slightly from 60.4 percent last week to 59.9 percent this week, while his approval rating dropped from 36.3 percent to 36.1 percent.
Paid subscribers to 50+1 get access to premium analysis, plus sortable tables and complete data access on our polling website. If you want to follow the 2026 cycle with the best data at your fingertips, become a paid subscriber.
In order to more easily compare crosstab data, all numbers and charts used in this article are derived from a simpler LOESS regression average of generic ballot polling data, rather than the more complex model used in our main generic ballot polling average.