



Welcome to The Trendline, the FiftyPlusOne.news weekly polling roundup. Subscribe to get it delivered straight to your inbox and get bundled access to our polling website.
We’re less than three weeks out from the midterm elections, and our team here at FiftyPlusOne is hard at work collecting up all the polls and data to help understand how things are shaping up in the race for Congress this year. But there’s a question that we’ve been kicking around on Slack this whole week: Where the hell are all the polls??
Yes, poll lovers, you are not imagining things. We do not have nearly as many polls this year as we’ve been accustomed to in past midterm cycles. In many Senate races, we’re practically flying blind, which may mean some surprises in what looks to be a particularly turbulent environment.
Compared to previous midterms, September looks fairly average in terms of the number of public Senate polls conducted.1 There were 129 polls of Senate races conducted in September, compared to an average of 147 in the last four midterm cycles, and almost identical to the 130 such surveys in 2022. When we hit October, though, the polls seem to dry up. Just 66 Senate surveys have been released that were conducted in October, far less than the average of 123 at this point in the election over the last four cycles (Note: Only polls with field dates more than 18 days prior to the election are counted here).
Now, this number is sure to change. Some surveys probably haven’t been released yet that have field dates in our October window, so we will see this number increase. But it seems unlikely that we see the number of such polls double as the race comes to a close.
Not only do we have fewer polls than usual, we have polls in fewer races than usual. There are typically 35 or so Senate seats up each cycle; this year we have 35 races, including special elections. But so far, we’ve only seen polls for 19 races conducted in October; in previous cycles, we had polls for far more races. Just 54 percent of this cycle’s Senate races have publicly available polling in October so far.
This is clearly a trend that has been accelerating over the last few cycles. In 2014, we had October polls more than 18 days before the election in 34 of 36 races, more than 94% of all races, but the number has consistently declined since then.
This is a problem in a year like 2026, where the political environment seems to be getting shaken up. We’ve seen changes in vote intentions among all sorts of groups, including Hispanic voters, rural and suburban voters, and independents compared to previous years, and these shifts have the potential to significantly change the electoral map. But in many races that could be impacted, we’re flying completely blind. We have no October polling in South Carolina, for example, where the late Sen. Lindsay Graham’s sudden death and replacement by his sister Darline Graham Nordone, a political newcomer, has led to closer polling than we otherwise would have expected.
In other states with significant rural populations, we haven’t seen any data in months: The last Oklahoma and Kentucky polls were in August, for example, and there haven’t been any public polls whatsoever out of West Virginia or Wyoming so far this cycle. While we don’t expect the Senate races in these states to be particularly close, there could be something going on: President Donald Trump held a rally in Oklahoma earlier this month, a surprising choice if there aren’t any competitive statewide races.
And with the map this year seeming to expand into more and more states, in many cases we have absolutely no data to help determine whether a race might be competitive. For example, Sabato’s Crystal Ball recently moved the Mississippi Senate race from Solid R to Likely R. But why? At the time of the change, the most recent publicly available survey was a poll from a Democratic PAC from August, showing Republican Sen. Cindy Hyde-Smith with a slim 6-point lead. While race raters like Sabato typically have access to private data that most people don’t, it’s hard to see from the outside what could have prompted such a change and what the state of the Mississippi race actually is.
When it comes to the most competitive races, however, we are still getting data. In this analysis, we define a race to be competitive if at any point in the cycle the Cook Political Report rated it as either Lean R, Lean D, or Toss Up. There are 10 such races in 2026, and we have October polls in all 10. On average, there are 4.7 polls in each competitive Senate race, roughly on par with the 4.6 polls in competitive races in 2018, though lower than all other previous midterm cycles since 2010.
And lest you think this problem is limited to the Senate, we only have 31 polls of individual House races conducted in October so far. That compares to a high of 166 in 2010, though the amount of House polling has been declining over recent cycles.
Of course, this trend of fewer polls toward the end of the cycle is nothing new. In fact, we ourselves wrote about this same problem in 2024, noting fewer polls than the past few presidential years, and the trend of more and more polls conducted in the most competitive states, as we see this year. In 2024, that may have been less of a problem, since the election was fought on more or less expected grounds. This year, however, with potentially huge shifts among some voters, we may be in for some surprises in November.
Other polling nuggets
In the latest Gallup polling (Sept. 1 - 17, 2026), 59 percent of Americans said the views and policies of the Republican Party were too extreme, while 43 percent said the same about the Democratic Party. That 16-point gap was the largest Gallup has recorded since they began asking the question in 2000 (though they’ve only asked it six times in total). In 2022 and 2020, the gap between the two parties was only 3 and 5 points, respectively, and 2022 was the only time that more Americans said the Democratic Party was too extreme than said the same about Republicans. Since 2022, the share of respondents who said the Democratic Party was “too liberal” dropped by 9 percentage points, while the share who said the Republican Party was “too conservative” rose by 7 points. When asked about the extreme wings of each party, Americans viewed the Democratic Socialists of America a bit more favorably than the Make America Great Again movement, though both were still heavily unpopular. The DSA had a net favorability rating of -16 points, while MAGA’s net rating was -25 points.
A new poll from Public First for Politico (Oct. 3 - 5, 2026) seems to indicate that even if gas prices were to drop dramatically, inflation cooled down, and Trump ended the war in Iran, it may not swing many votes. Just 10 percent of undecided voters said they would be more likely to vote Republican if gas prices went down by $1, and only 12 percent said they would be more likely to vote GOP if inflation fell to its lowest level in five years. In fact, about 5 percent said that either of these things would make them less likely to vote Republican. Overall, though, a majority of undecided voters said they weren’t sure how these events would influence their vote. Of course, you should take all these numbers with a grain of salt: Humans are notoriously bad at predicting how they might act in the future given new situations. And many view these scenarios as unlikely — only 28 percent of Americans think that Trump could bring down gas prices by $1 before Election Day, and just 27 percent think he could bring grocery prices down significantly.
Democrats have a huge lead on the generic ballot, and in a YouGov poll released today (Oct. 2 - 5, 2026), the Democratic Party has a 6-point advantage when Americans were asked which party they trusted more to make them financially better off. But most Americans weren’t optimistic that much will change should Democrats gain control of Congress in November. In fact, the exact same share of Americans (28 percent) said that such a scenario would make them better off, worse off, and about the same financially (17 percent weren’t sure). While those numbers aren’t exactly a ringing endorsement of the party, they’re better than the GOP’s metrics. Thirty-nine percent of Americans expected to be worse off financially if Republicans maintain control of Congress in the midterms, while 23 percent said they would be better off and another 23 percent said they’d be about the same. But either of those options seems better to Americans than if the parties split control of Congress — just 8 percent of Americans think their finances would be better off in that scenario.
The Vatican announced this week that Pope Leo XIV underwent successful surgery to remove a cancerous tumor in his lung. In a YouGov poll yesterday (Oct. 15, 2026), 63 percent of Americans said they think praying for an ill person helps them get better at least sometimes, and 45 percent said they pray for someone who is ill at least once a week. Many of those prayers almost certainly went to the pope — 53 percent of Americans had a favorable view of Leo, while only 14 percent had an unfavorable view. And a solid share (45 percent) of the public remains optimistic that a cure for cancer will be discovered within our lifetimes. Best wishes to the pope as he continues his recovery.
Polling averages update
All numbers are as of 12:00 PM Eastern on Oct. 16, 2026.
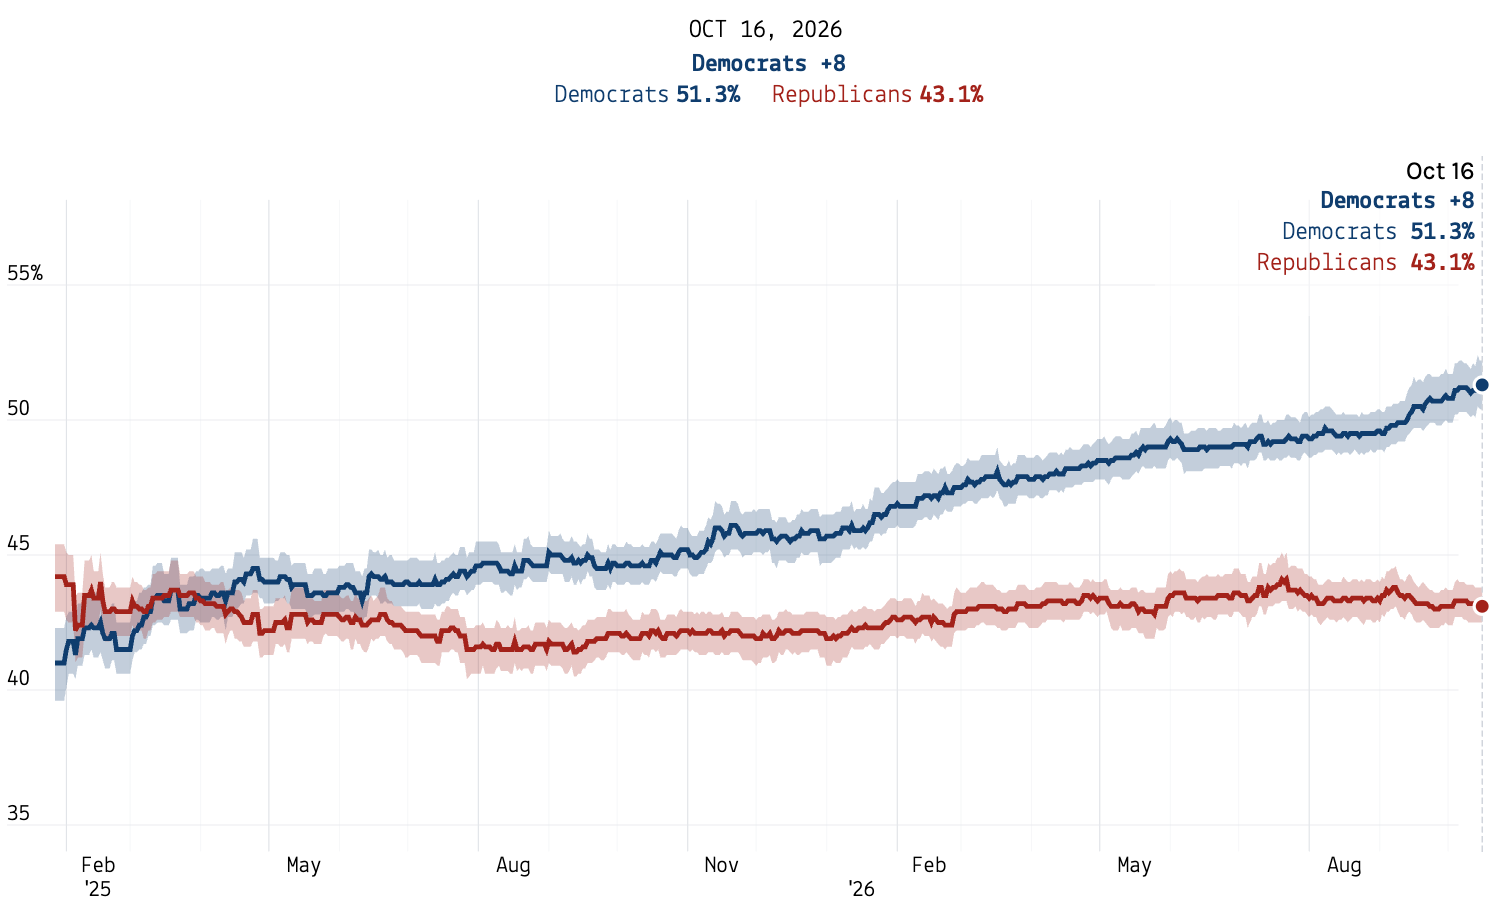
2026 U.S. House generic ballot
The Democratic margin in the 2026 U.S. House generic ballot grew slightly this week, though it still rounds to an 8-point margin. Currently, 51.3 percent of likely voters say they plan to vote for a Democrat in November, compared to 51.1 percent last week, while the percent that say they plan to vote for a Republican fell correspondingly, from 43.3 percent last week to 43.1 percent this week.
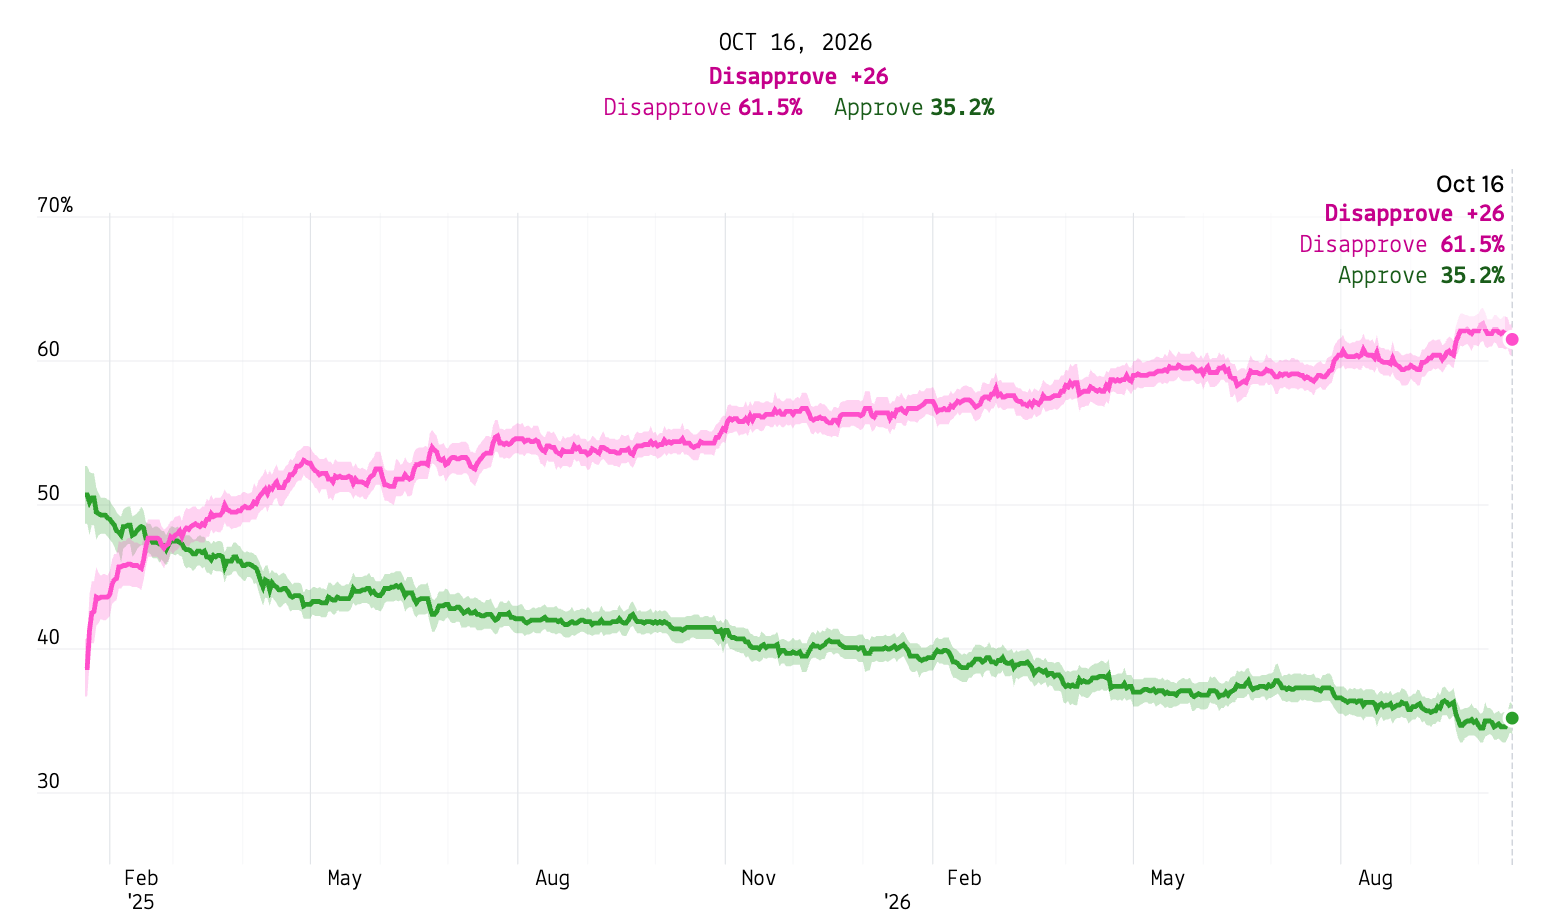
Trump’s job approval
President Trump’s net approval rating among U.S. adults improved a bit this week. His net approval among Americans is now at -26 percentage points, up from -28 last week. Overall, 61.5 percent of Americans disapprove of the president’s job performance, while 35.2 percent approve.
Paid subscribers to 50+1 get access to premium analysis, plus sortable tables and complete data access on our polling website. If you want to follow the 2026 cycle with the best data at your fingertips, become a paid subscriber.
We are classifying polls by the month of their final field date. While a more appropriate classification may be the date on which a poll was released, we do not have that data for historical surveys. Data in this article is as of 9:00 a.m. Eastern on Oct. 16, 2026.