

Trump is barely above water among white voters without a college degree
But the group still plans to vote for Republicans in November


A crosstab tucked into a recent Marist University survey caught the attention of some political commentators: President Donald Trump’s approval rating in the poll among white voters without a college degree is underwater by two percentage points, 46 percent to 48 percent. Among white men without a degree, the survey showed Trump underwater by 3 percentage points, 46 percent to 49 percent, and among white women without a college degree, he was dead even, with 47 percent saying they approved and 47 percent saying they disapproved.
That polling tidbit made its way around social media, with some speculating that the poll indicates that Trump’s support among the white working class — a group he won by nearly 30 points in 2024 — may now be underwater. Others argued that the deterioration of support among white noncollege voters might indicate potential catastrophe for the midterms. Of course, it’s worth acknowledging that “white votes without a degree” is not really the same as “white working class” (whatever that even means), but it is the demographic group for which we at least have some polling data to go on.
So, has Trump really dropped this much among white voters who don’t have a degree? And what does that mean for the midterms? Is the Marist poll an outlier, or part of a bigger trend?
Breaking down Trump’s approval among noncollege whites
In national polling, Trump’s approval has fallen significantly over the course of his presidency. (Data in this article reflects all polls that were available by 5:00 p.m. Eastern on Mar. 17, 2026.)
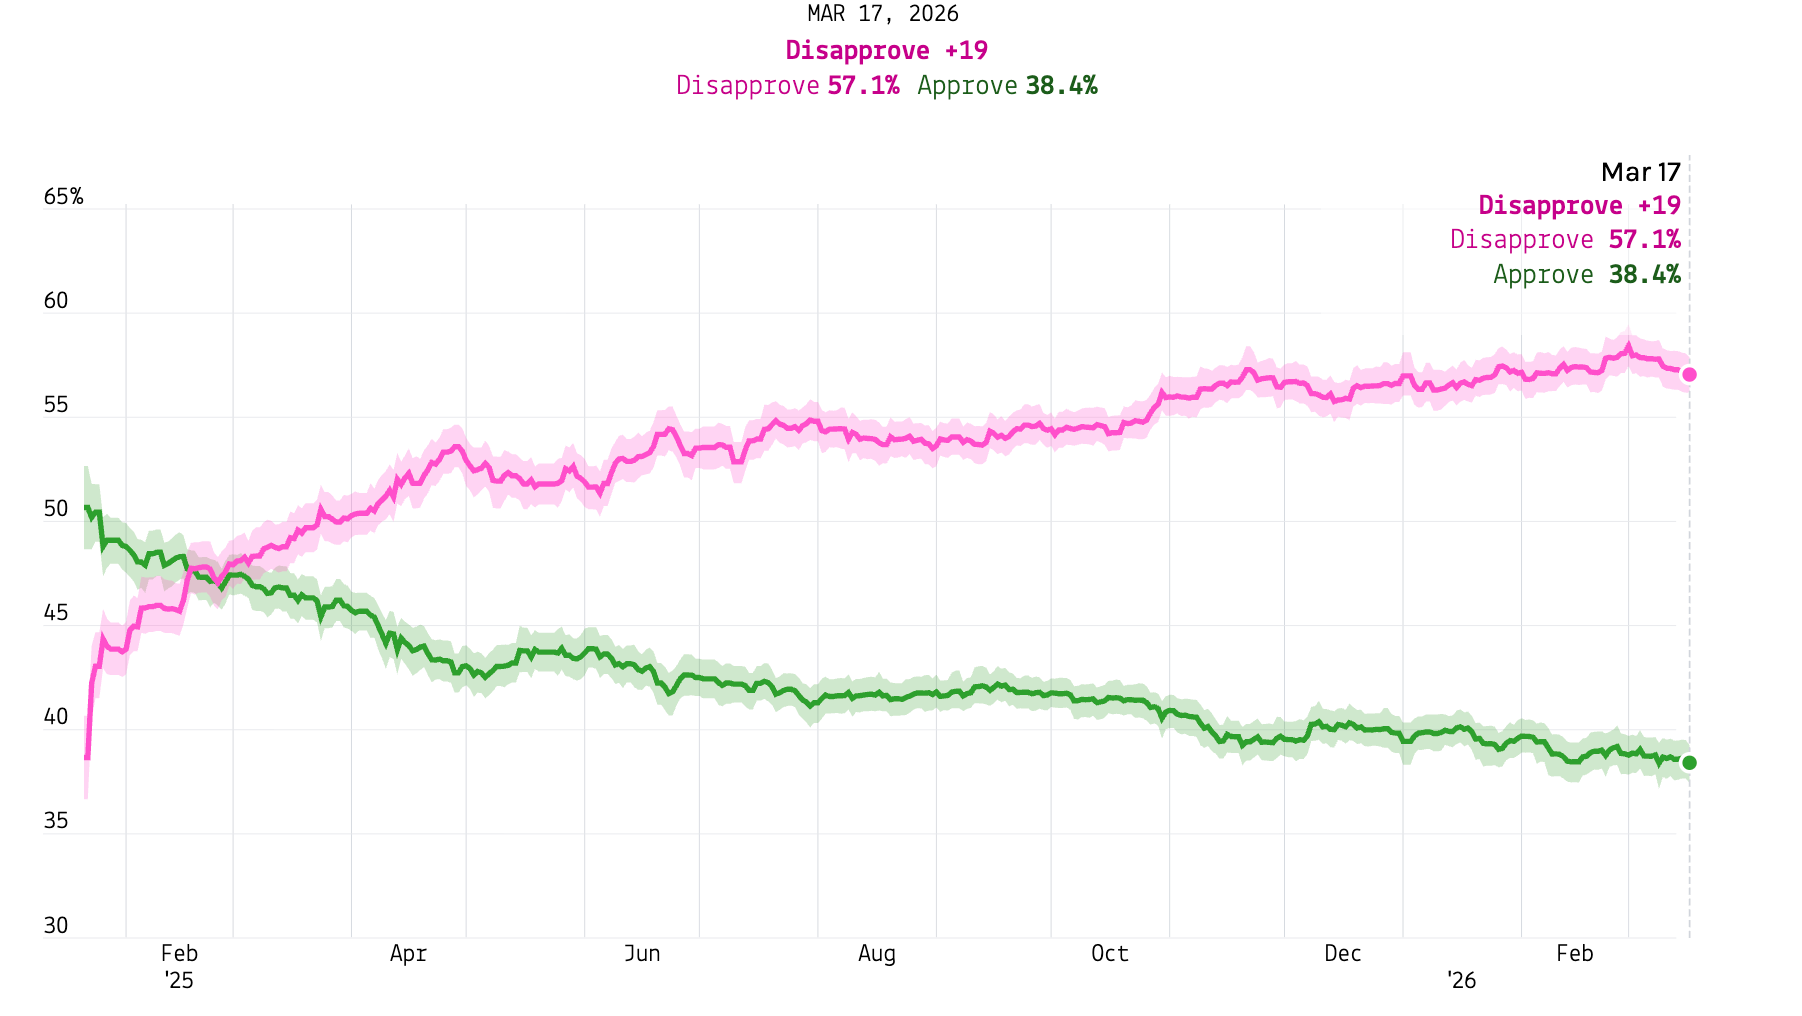
When it comes to white voters without a college degree, the polls generally agree with Marist that Trump’s approval has fallen with that demographic as well. But they disagree on Trump’s exact level of support. In our average of polls that break out Trump’s approval rating by demographic group, Trump started his term with nearly a 61 percent approval rating among white voters without a degree, while around 35 percent disapproved; we estimate that today, that approval rating has fallen to around 51 percent, with 47 percent disapproving.
That is certainly a big shift. But when compared to the changes among other groups of voters, the magnitude of the shift among this specific demographic isn’t particularly significant. When we look at shifts in the net approval rating (the difference between the number of respondents who say they approve and the number who say they disapprove of the president), both overall and among white voters with and without a degree, we see parallel movement throughout Trump’s first term.
This sort of uniform change in polling is generally fairly common. It’s far more unusual to see a demographic group moving significantly more than the population overall than following the same pattern, and when that happens, we let you know.
Noncollege whites still prefer Republicans in the generic ballot
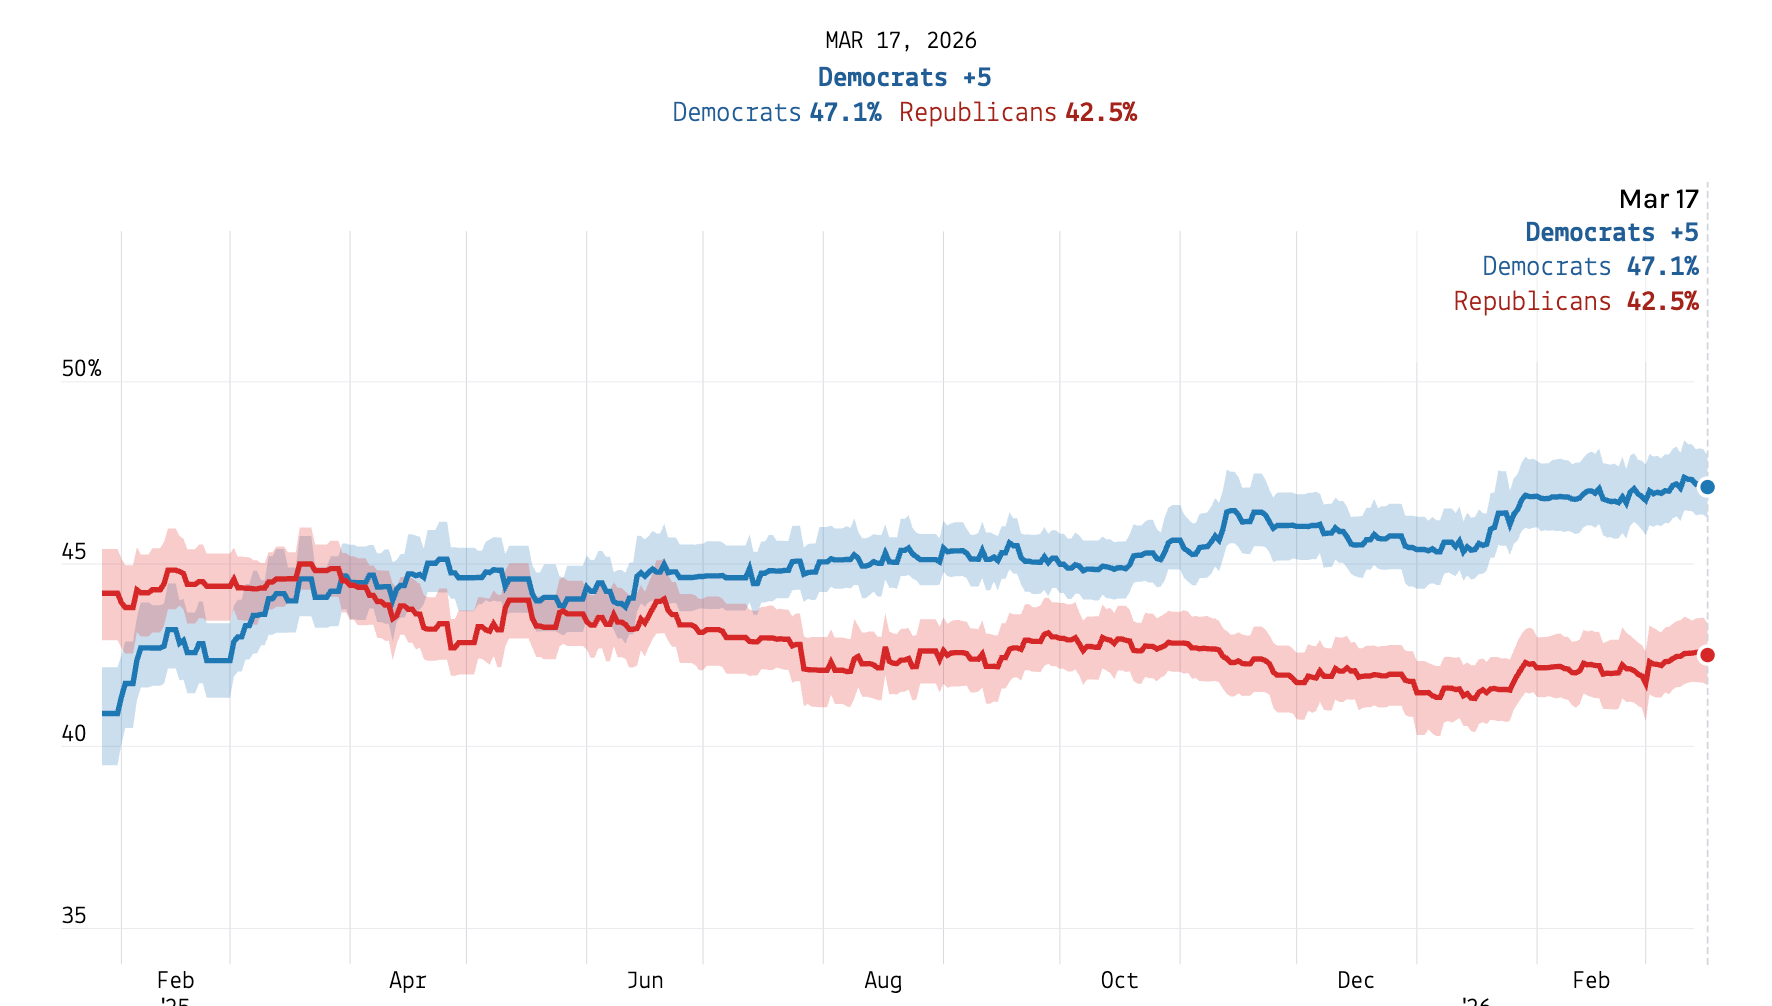
The erosion of Trump’s approval rating among white noncollege voters doesn’t seem to be translating to erosion of support on the generic ballot. Over the course of Trump’s second term, our estimates of support on the generic ballot in November among white college educated voters and white voters without a college degree have barely budged.
From the beginning of our tracking today, Democrats’ margin among white voters with a college degree has increased by less than 3 percentage points, and Republicans’ margin among white voters without a college degree has decreased by less than 3 percentage points. We don’t have enough data to compute an average for white voters by education prior to April 21, 2025, so we aren’t able to see exactly where these groups were at the beginning of Trump’s term. But in our tracking, this movement is fairly similar to what we see on the topline: on April 21, 2025, Democrats were ahead by 2 points in our topline, and are ahead by 5 points today.
Indeed, even in the same Marist poll that showed Trump underwater with white voters without a college degree, Republicans led among the group on the generic ballot. Marist showed Republicans ahead by 17 points with white voters without a degree on the generic ballot, consistent with our estimates. Among white men without a degree, Republicans led by 15 points.
To be sure, there are reasons to be a bit skeptical about the polling among white voters by education. We only have 23 surveys in our dataset that provided crosstabs for this group, which is a fairly small sample size to go on. But if we consider white voters overall, we have 249 surveys, and our estimates for that group show similar movement–white voters have moved about 3 points, on the margin, toward Democrats since April 21, 2025.
And generally speaking, when we break out different demographic groups, we see parallel movements on the generic ballot, suggesting in most cases a fairly uniform swing. There are, of course, exceptions to that rule—particularly when we consider crosstabs by age—but most groups appear to be shifting by about the same amount over time. So that should give us some confidence that the estimate, while based on somewhat thin data, is capturing a realistic snapshot of these demographics.
Regardless of whether white voters without a degree have been moving towards Democrats over the past year, though, analysis from the Pew Research Center suggests that Republicans’ standing with this demographic has been eroding throughout Trump’s time on the national stage. Pew estimates that in 2016, Trump won white voters without a degree by 36 points; by 2020, that margin had shrunk to 32 points, and in 2024, they estimate he won white noncollege voters by 29 points, 64 percent to 35 percent. Trump’s improvement from an 8-point win among all voters without a degree in 2020 to a 14-point win in 2024 appears to be driven entirely by nonwhite voters: Black voters without a degree moved 18 points toward Trump, and Hispanic voters without a degree moved 20 points, per Pew’s estimates.
In some ways, Pew’s numbers jibe with our current polling average: we estimate that around 36 percent of white voters without a degree would vote for a Democrat in November, fairly similar to the 35 percent that Pew estimates Harris won in 2024. It’s the Republican estimate that is dragging down the margin for the GOP here–we estimate that around 54 percent of white noncollege voters would choose a Republican this fall, far less than the 64 percent that voted for Trump in 2024. It may be the case that the roughly 10 percent undecided voters among this demographic will ultimately lean toward Republicans; based on the data we have right now, it’s impossible to say what that group of undecided voters look like.
Here’s the bottom line: Yes, Trump’s approval rating among white voters without a degree has dipped over the last year—but so has his rating among pretty much every demographic group in the country. There is little evidence that this group is moving faster against the president than any other group, and surveys showing Trump underwater with noncollege whites are, for now, outliers. The group is also roughly as GOP-leaning on the House generic ballot as it was at the start of Trump’s presidency — though, even then, polls showed the group moving left compared to where they were in 2024. The data so far suggest the group is not turning on the Republican Party, even if many have soured on the president.
Paid subscribers to 50+1 get access to premium analysis, plus sortable tables and complete data access on our polling website. If you want to follow the 2026 cycle with the best data at your fingertips, become a paid subscriber.
Methodology
To estimate demographic subgroup trends for presidential approval and generic ballot, we use an exponentially weighted moving average (EWMA) that adjusts polls for their sample size, recency, subgroup noise, and movement in the Trump’s national approval trend and generic ballot trend since each poll was conducted. The following methodology statement refers to Trump approval polling; the same steps are taken to calculate generic ballot estimates.
We calculate this average in five steps. For any given day, we look at the polls conducted for a subgroup on or before that day, and do the following:
First, each poll’s approve and disapprove vote shares are de-trended by subtracting the corresponding national topline estimate on the poll’s end date, isolating each subgroup’s deviation (aka residual) from the national environment on that day. If the national average for Trump’s approval is 45% on the day a poll is released and the subgroup result is 50%, for example, we record the subgroup residual as +5.
Second, we calculate a EWMA with a decay rate of 0.96 (roughly a 17-day half-life) on these de-trended residauls from all polls for this subgroup. Then we add back the national topline from whatever day we are running the average to produce trend-adjusted subgroup estimates. This ensures our average accounts both for movement in the national average (which gets polled more often) and a subgroup’s overall lean toward one party.
Third, we compute house effects for each pollster in each subgroup based on how much their polls differ from the average. Each firm’s house effect is equal to the average difference between their results and the trendline-adjusted national average on the day the pollster released their results. We then shrink the house effect toward zero to account for noisy residuals, via the formula `adjusted = raw_effect * n / (n + 5)`, where n = the number of polls from a pollster among that subgroup. So a pollster with 1 poll keeps 1/6 (~17%) of their estimated bias. With 5 polls it’s 50%, with 10 polls it’s 67%, etc. This ensures that when we have relatively few results from a given pollster, we aren’t overconfident in their house effects.
Fourth, we subtract each pollster’s house effect from their results, and then calculate a new aggregate estimate using poll readings that are adjusted both for house effects and movement in the national generic ballot average. We do this by repeating steps 1 and 2 above, but using the house-effect-adjusted poll results instead of the raw results. That gives us a final EWMA for approve and disapprove shares in the demographic group!
The final step is to blend this EWMA with a model-based prior prediction of the average that is used to smooth out phantom swings that can result from noisy data. The modeled prior for each subgroup is simply the national topline plus that group’s average historical residual values — giving us a stable estimate of where the group “should” be on any given day based on the overall national environment (i.e., not one that is not weighted by recency, which can exacerbate noise in the trend).
The amount of weight assigned to the modeled prior vs EWMA depends on the cumulative information provided by the polls for each subgroup: groups with many recent, large-sample polls that consistently agree with each other will be driven almost entirely by the EWMA, while groups with few, small, or noisy polls will lean heavily on the modeled prior. This effective weight also incorporates a reliability score for each subgroup, estimated by comparing the variance of that group’s de-trended poll results to the median variance across all groups. Subgroups whose polls are noisy and inconsistent accumulate effective weight more slowly, keeping them closer to the modeled prior even when poll counts are similar to more stable groups.
The final averages we report for each group is thus equal to a weighted average of the EWMA for that group and the modeled estimate, using the following formulas:
w = eff_weight / (eff_weight + 20)final = w * EWMA + (1 - w) * model_prior
Where eff_weight is the cumulative sum of decayed poll weights (each poll’s sqrt(sample_size) * reliability, decayed by 0.96 per day since the poll was conducted). So at eff_weight = 20, it’s a 50/50 blend. At eff_weight = 60, it’s 75% EWMA. A brand new group with one small poll might have eff_weight around 5, giving ~20% EWMA and ~80% prior.
Seems like self-described independents have moved fastest away from Trump?
I'd love to see a distribution of where self-declared independents put themselves on the left-right political spectrum.