



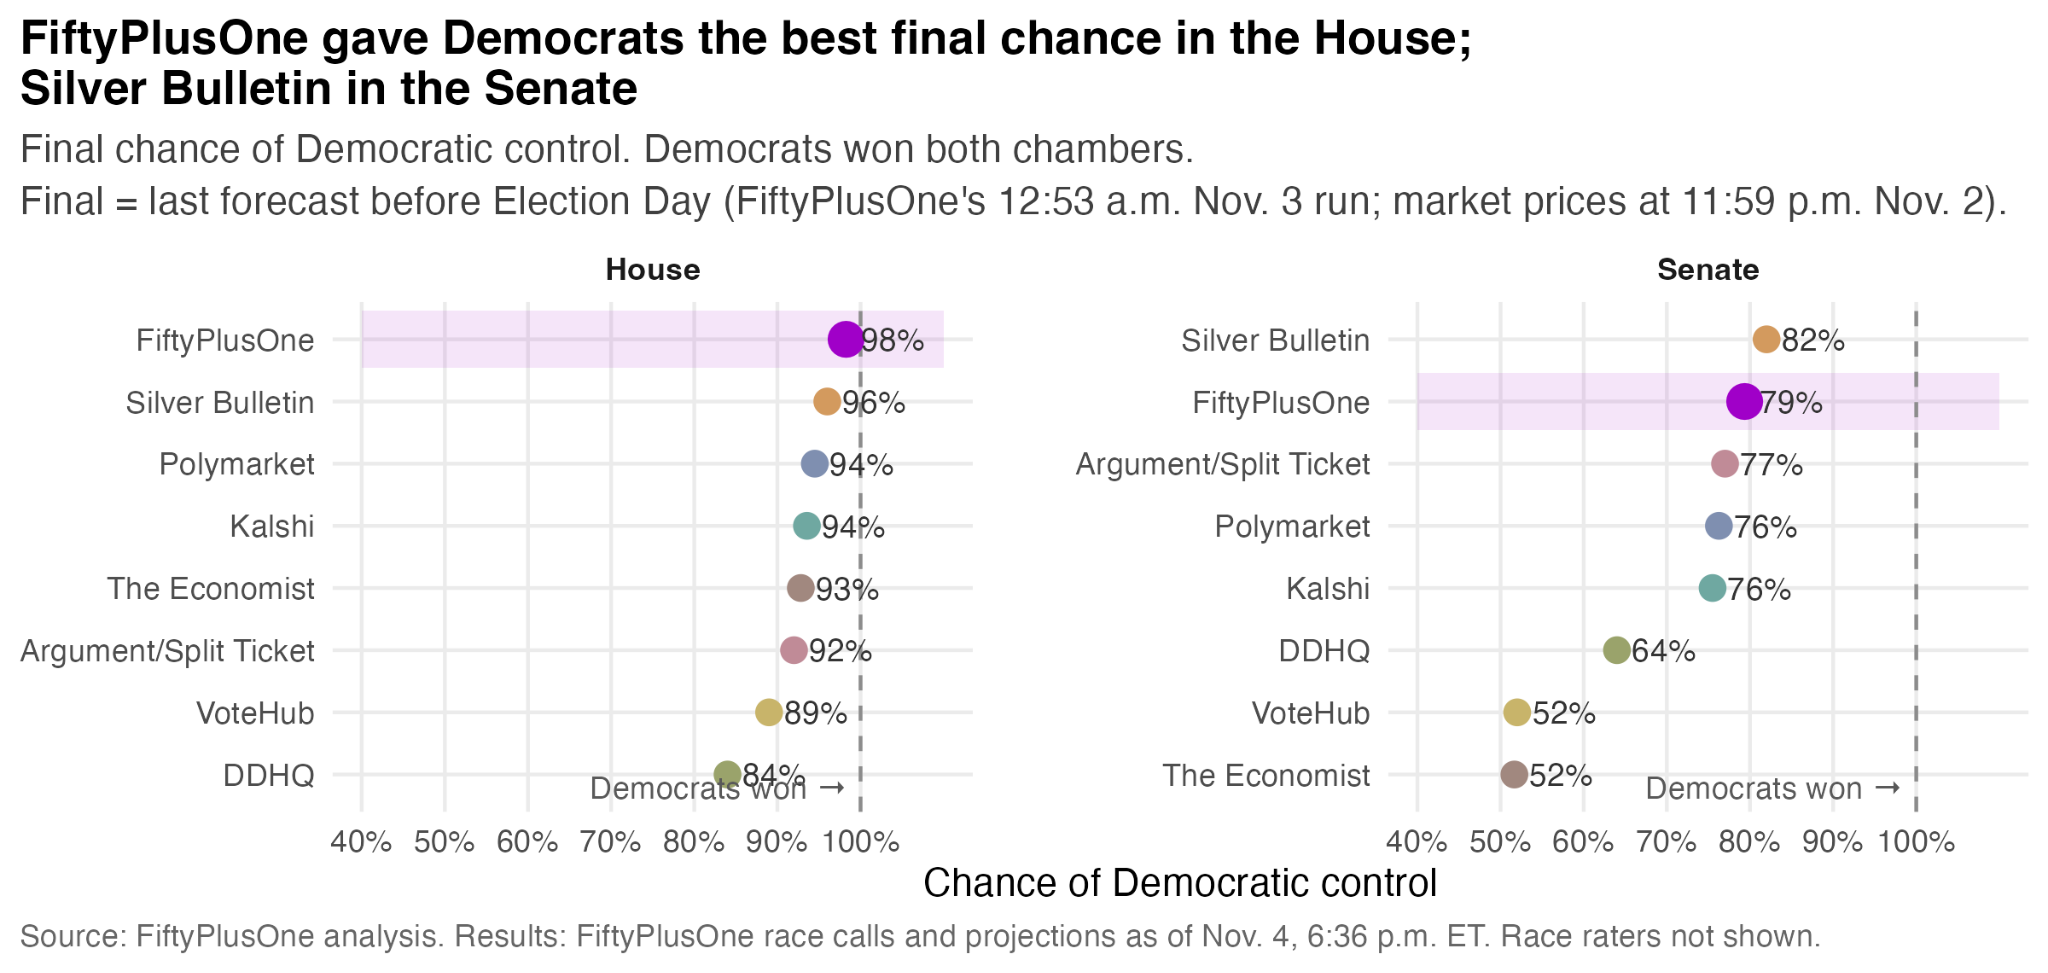
Going into Election Day on Tuesday, Nov. 3, our model at FiftyPlusOne gave Democrats a 98 percent chance of winning the U.S. House of Representatives. That was higher than any other forecaster we tracked, and higher than the prediction markets, where people were betting real money on the outcome. Other forecasters clustered in the mid to low 90s as well: Nate Silver’s Silver Bulletin was 96 percent, Polymarket at 94.5 percent, Kalshi at 94 percent, The Economist and Split Ticket at 92 percent to 93 percent, VoteHub at 89 percent and Decision Desk HQ (DDHQ) at 84percent.
Democrats have now won or are projected to win 255-260 House seats. In the end, the election was not close.
In the Senate, we gave Democrats a 79 percent chance of winning a majority, second only to Silver Bulletin’s 82 percent and ahead of both prediction markets (Polymarket 76 percent, Kalshi 75.5percent), every other quantitative forecaster, and The Economist (where I used to work), which had the chamber at a coin flip.
This being FiftyPlusOne’s first year in existence (we had previous experience at FiveThirtyEight at ABC News), the team is thrilled by the strong performance on the big-picture forecasts. In this article, I grade the performance of our forecast alongside other prominent prognosticators based on what we know so far. The methodology for this analysis is included at the bottom of the page.
At the seat level, the calibration of our forecast has proved to be better than average among quantitative forecasters and the expert race raters, including the likes of Cook Political Report, as well as the prediction markets. We did miss some races (like everyone else), and that illustrates why it’s important to take uncertainty in forecasts into account.
Across six measures of forecast accuracy, the FiftyPlusOne model ranked second overall among eight election forecasters and the prediction markets, behind only Silver Bulletin.
Paid subscribers to 50+1 get access to premium analysis, plus sortable tables and complete data access on our polling website. If you want to follow the 2026 cycle with the best data at your fingertips, become a paid subscriber.
We were the most confident forecast and the most accurate on the House
The chart below shows the probability FiftyPlusOne assigned to Democrats winning the House and Senate compared to other forecasters. We were more accurate than any other forecaster in the House, and second to Silver Bulletin(by three percentage points) in anticipating control of the Senate.
The standard tool for testing the probabilistic calibration of an election forecasting model — figuring out if events we say had a 66 percent chance of happening truly happened about 66 percent of the time — is the Brier score. To calculate a forecaster’s Brier score, you take the probability they assigned to an event, subtract the number 1 if it happened and 0 if it didn’t, and square it. If FiftyPlusOne had perfectly calibrated forecasts, our Brier score would be 0; if we randomly guessed at outcomes, we would score a 0.25.
In the House, our final forecast scored 0.0003, the best of any forecaster or market we tracked. Silver Bulletin came in second at 0.0016. Then Polymarket (0.003), Kalshi (0.004), The Economist (0.005), Split Ticket (0.006), VoteHub (0.012) and DDHQ (0.026). These are all respectable performances, and very small differences in modeling approaches could have led any one of these outlets to generate forecasts that looked nominally “best” compared to other firms.
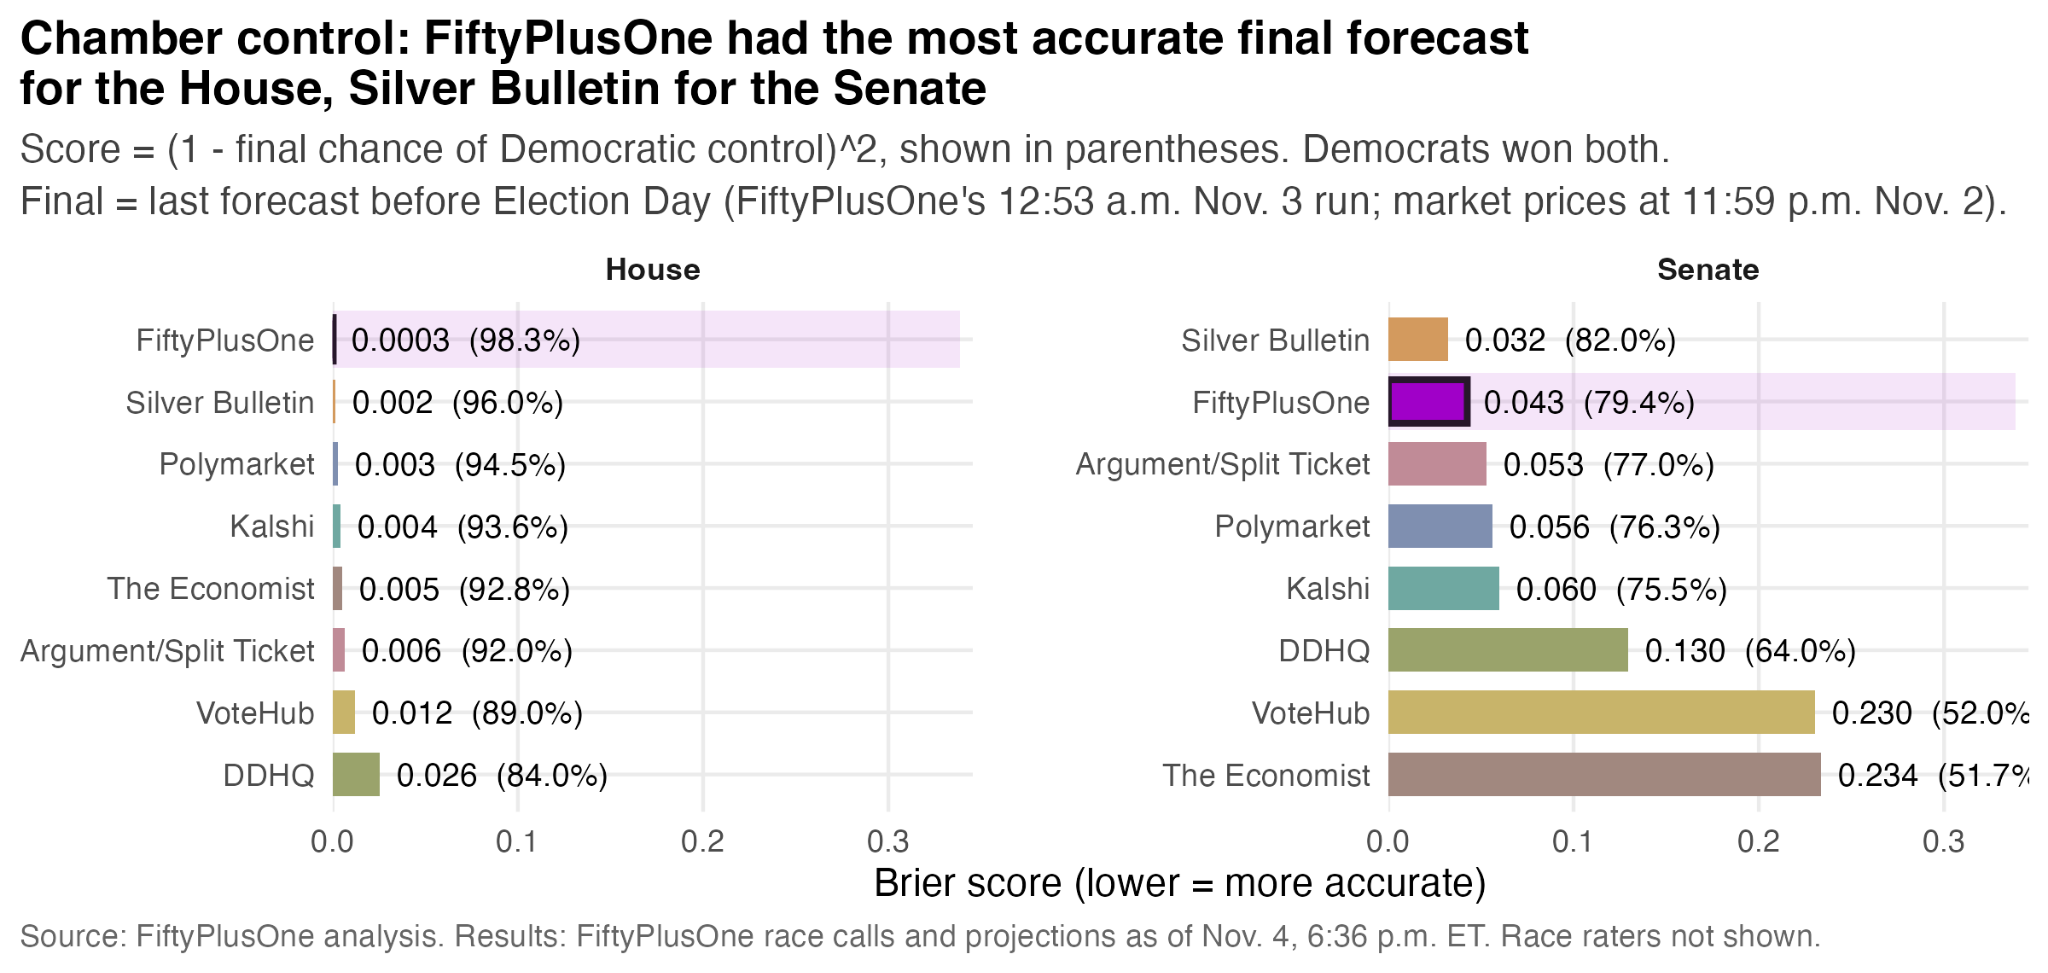
In the Senate, FiftyPlusOne finished second. Our 0.043 trailed Silver Bulletin’s 0.032 but beat both prediction markets (Polymarket 0.056, Kalshi 0.060) and all other forecasters. DDHQ, VoteHub, and The Economist scored between 0.13 and 0.23 on Brier score.
FiftyPlusOne beat the prediction markets months out
A particularly strong result for our model is that it significantly outperformed both the prediction markets and qualitative election handicappers (below, “race raters”) in anticipating aggregate control of both chambers. FiftyPlusOne was more bullish on the House and Senate every day of the campaign since Aug. 3rd.
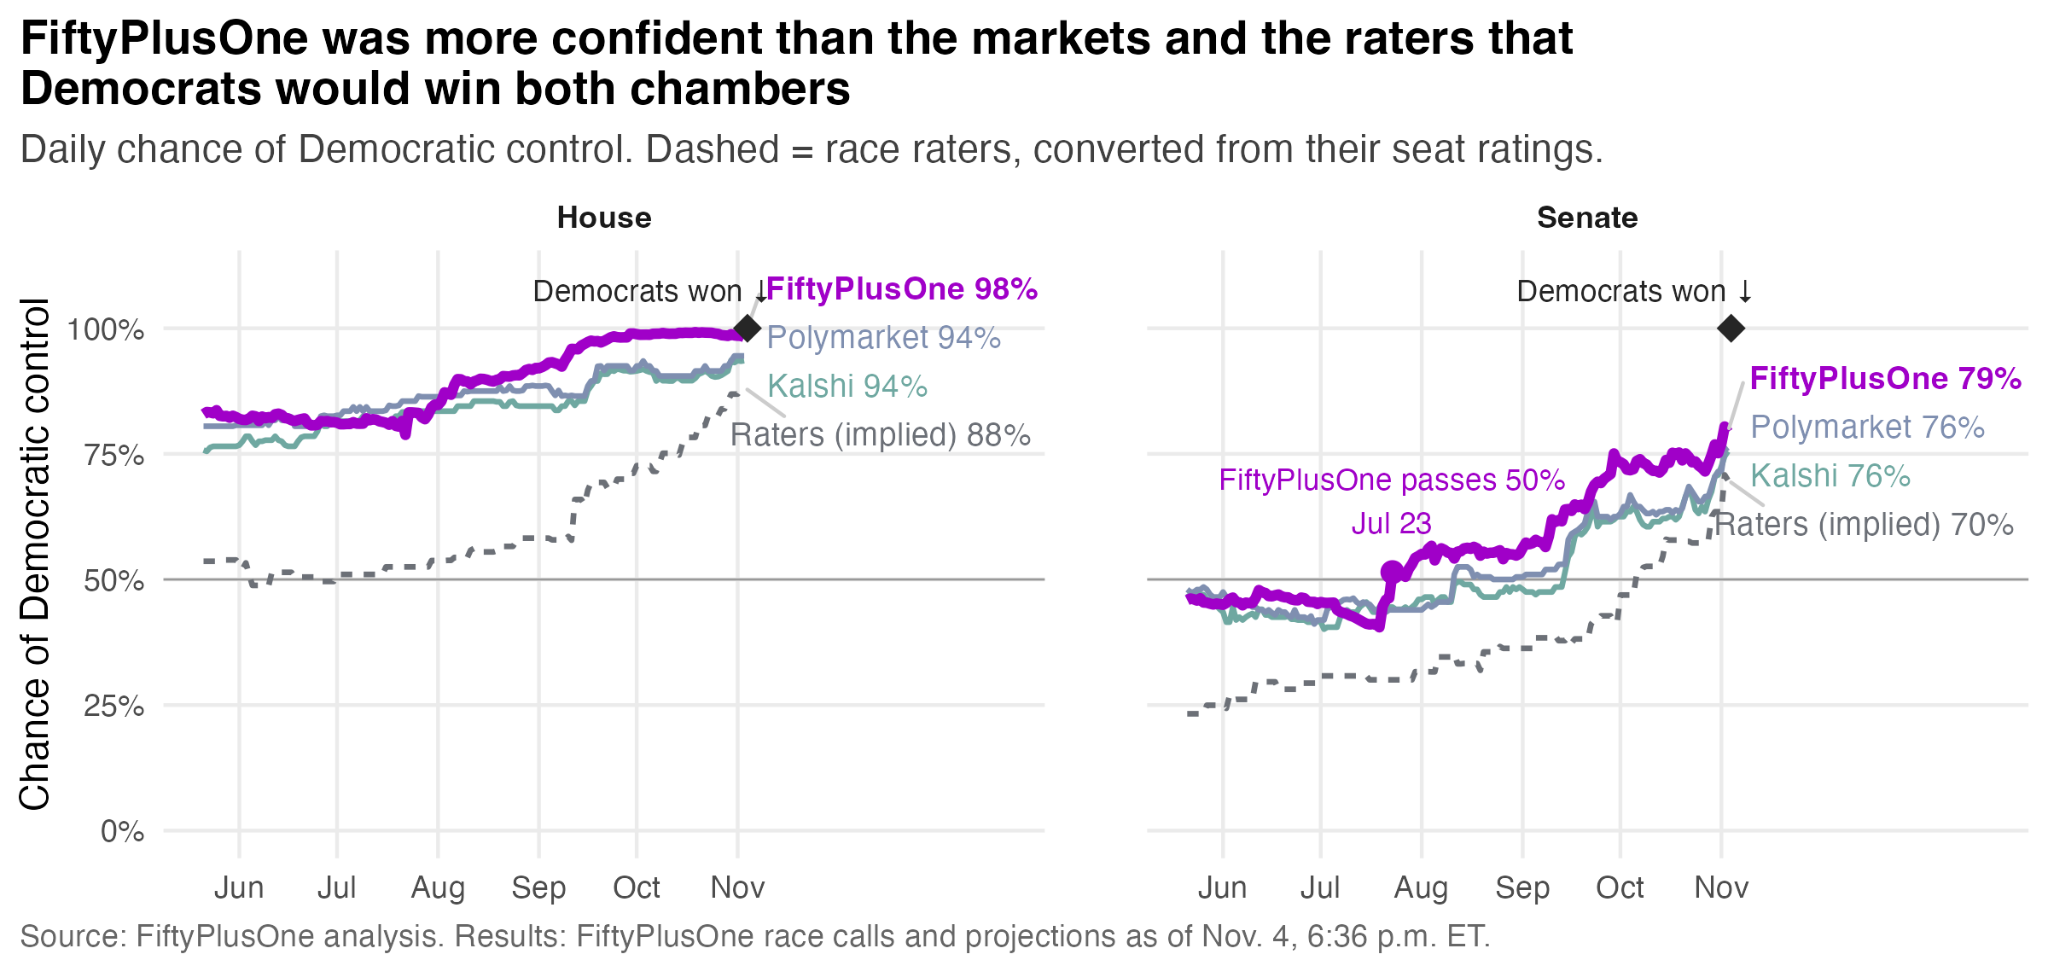
From late May through Election Day, our model gave Democrats an average 89 percent chance of winning the House. Polymarket averaged 87 percent and Kalshi 84 percent. In the Senate, we averaged 57 percent, vs 52 percent on Polymarket and 51 percent on Kalshi. Democrats won both chambers, so the higher number was the better one, and our campaign-long Brier score beat both the markets and the race raters in both chambers.
From Aug. 1 through Election Day, our forecast of who would control Congress beat Kalshi’s on all 95 days, in both the House and the Senate. Against Polymarket, we won all 95 days in the Senate and 93 of 95 in the House. If you were using our forecast to bet on prediction markets (which we absolutely do not endorse), you would have made money.
Where it mattered most — early in the campaign — our forecast at FiftyPlusOne had a large edge over the markets. The graph below shows the relative performance of our model versus both Kalshi and Polymarket from August through Election Day. When each line below is above the dark line at 0, that means you would have made money betting on Democrats to win the House and/or Senate in the corresponding prediction market.
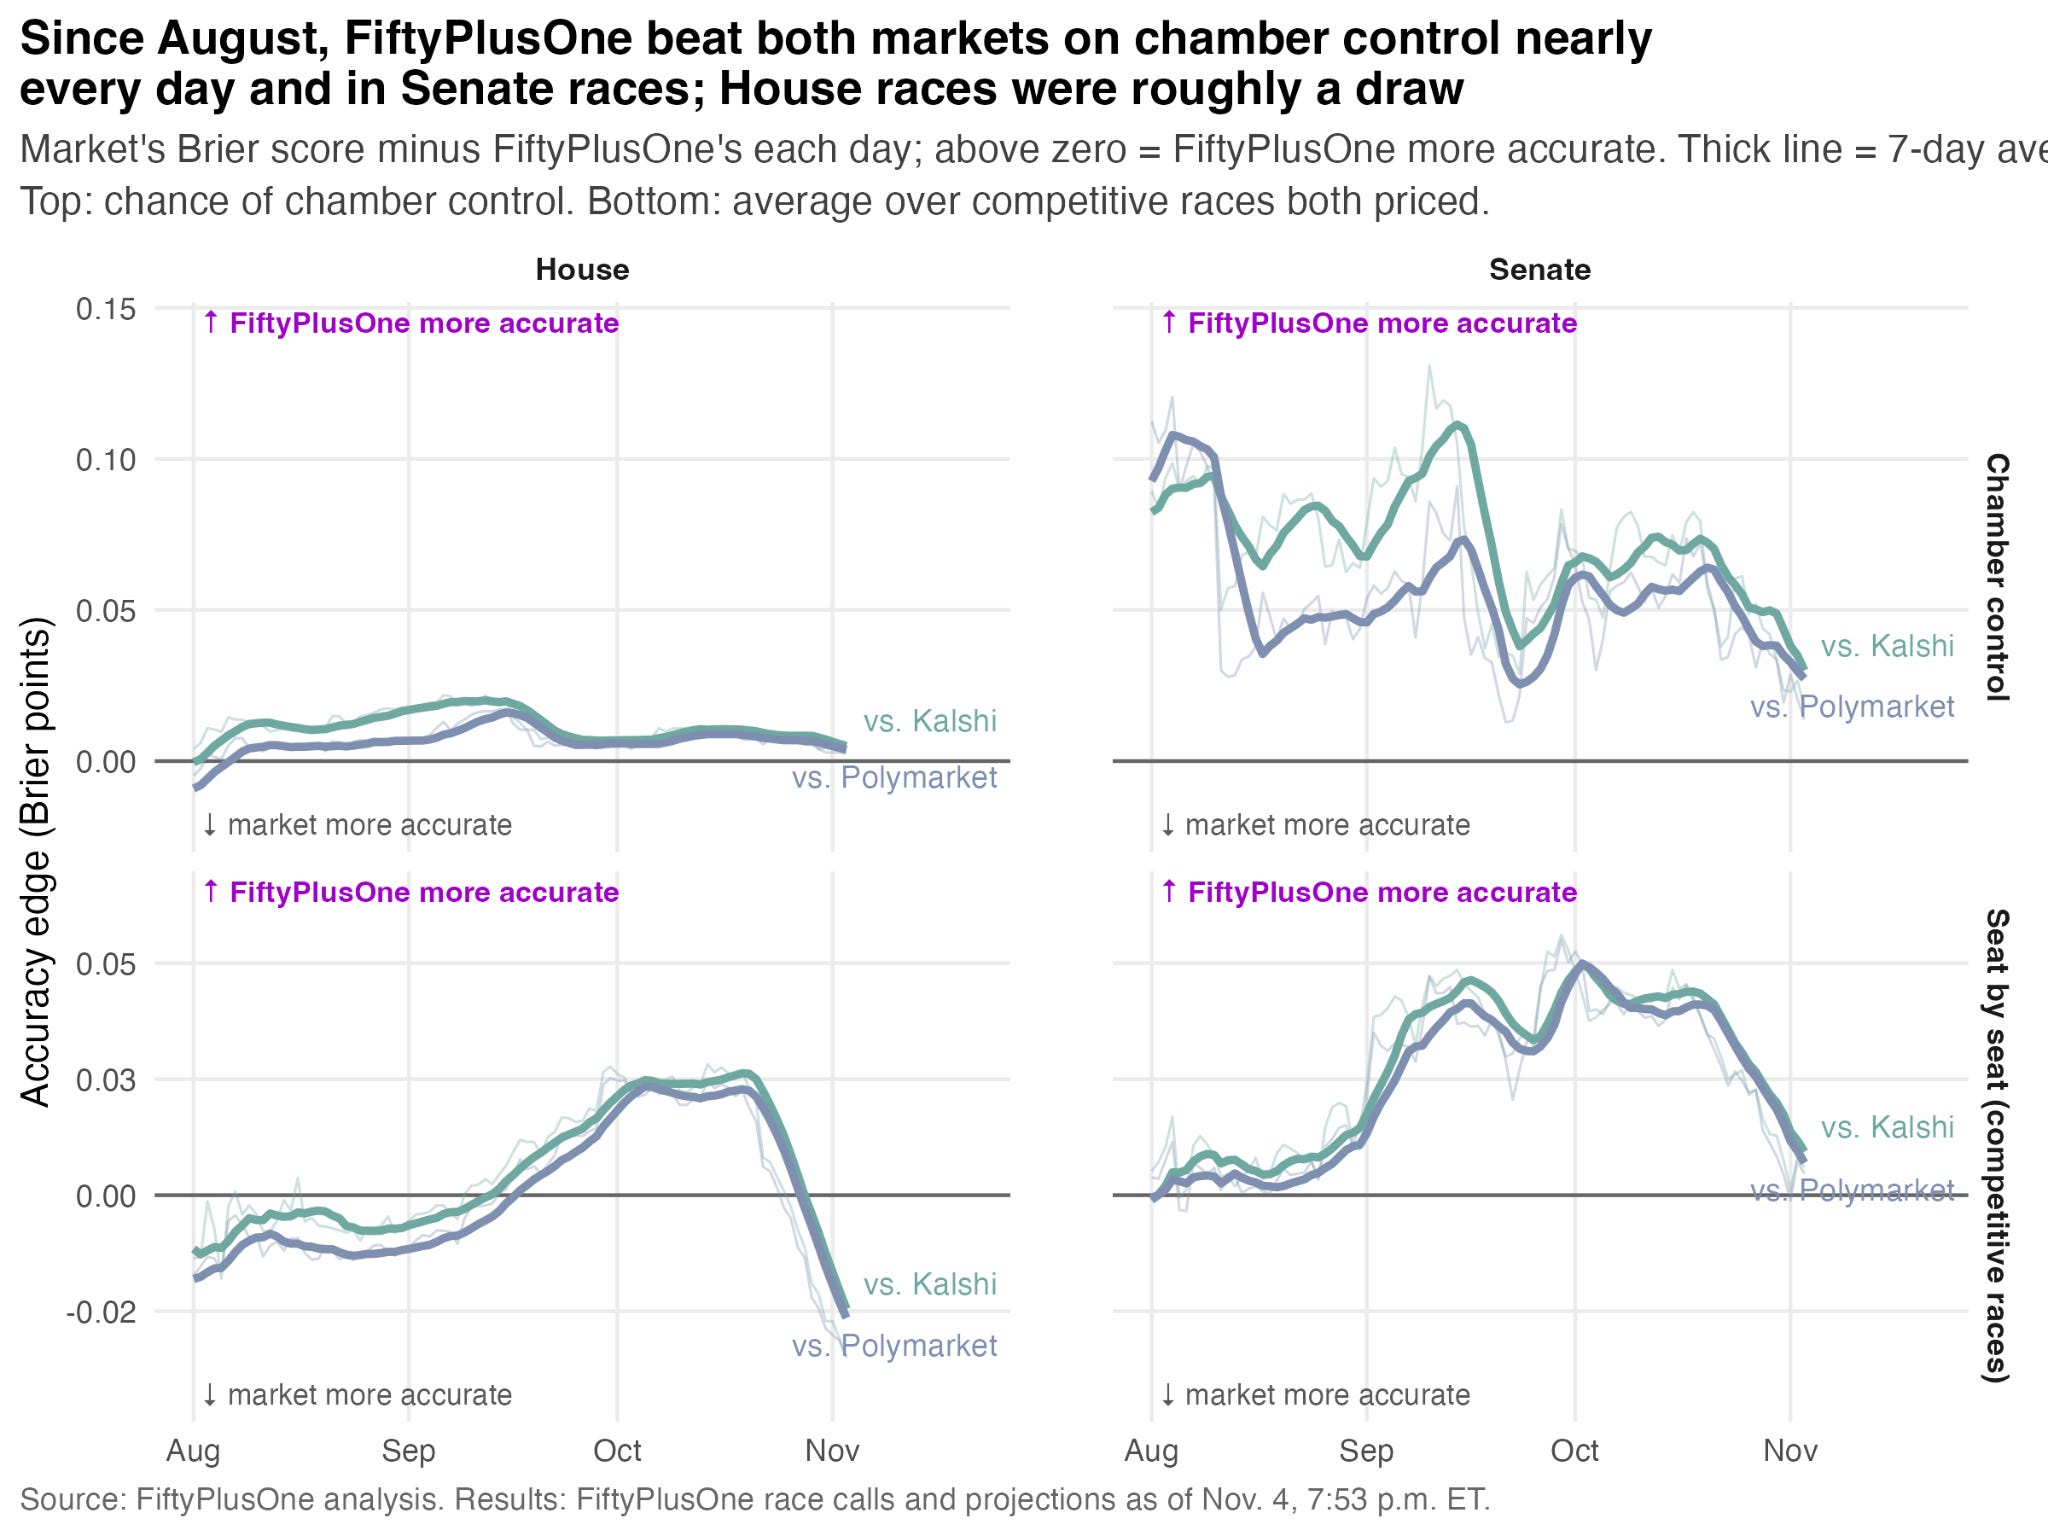
The bottom row of that chart grades individual races, and it tells a similar story. In the Senate, our race-by-race forecasts beat Kalshi on 94 of 95 days and Polymarket on 92. In the House, the markets had a slight edge for much of the summer. But we more than caught up in the fall. From Oct. 1 on, we beat Kalshi on 74 percent of days and Polymarket on 71 percent, and over the final 30 days we beat both markets in the Senate, and lagged in the House in the final two weeks.
Why does this matter? Boosters have been claiming since 2024 that prediction markets offer the smartest view about upcoming elections. But for most of the fall this year, a smart model built on the polls, “fundamentals,” and expert race ratings performed markedly better than the markets — without such models, the markets would likely be far worse.
Race by race, FiftyPlusOne was ahead of the pack
In the chart below, I rank major forecasters by their final election-day predictions in 421 called or projected House races, and 34 Senate races. These numbers may change slightly depending on how final ballots go in a number of close contests. As before, numbers closer to 0 are better.
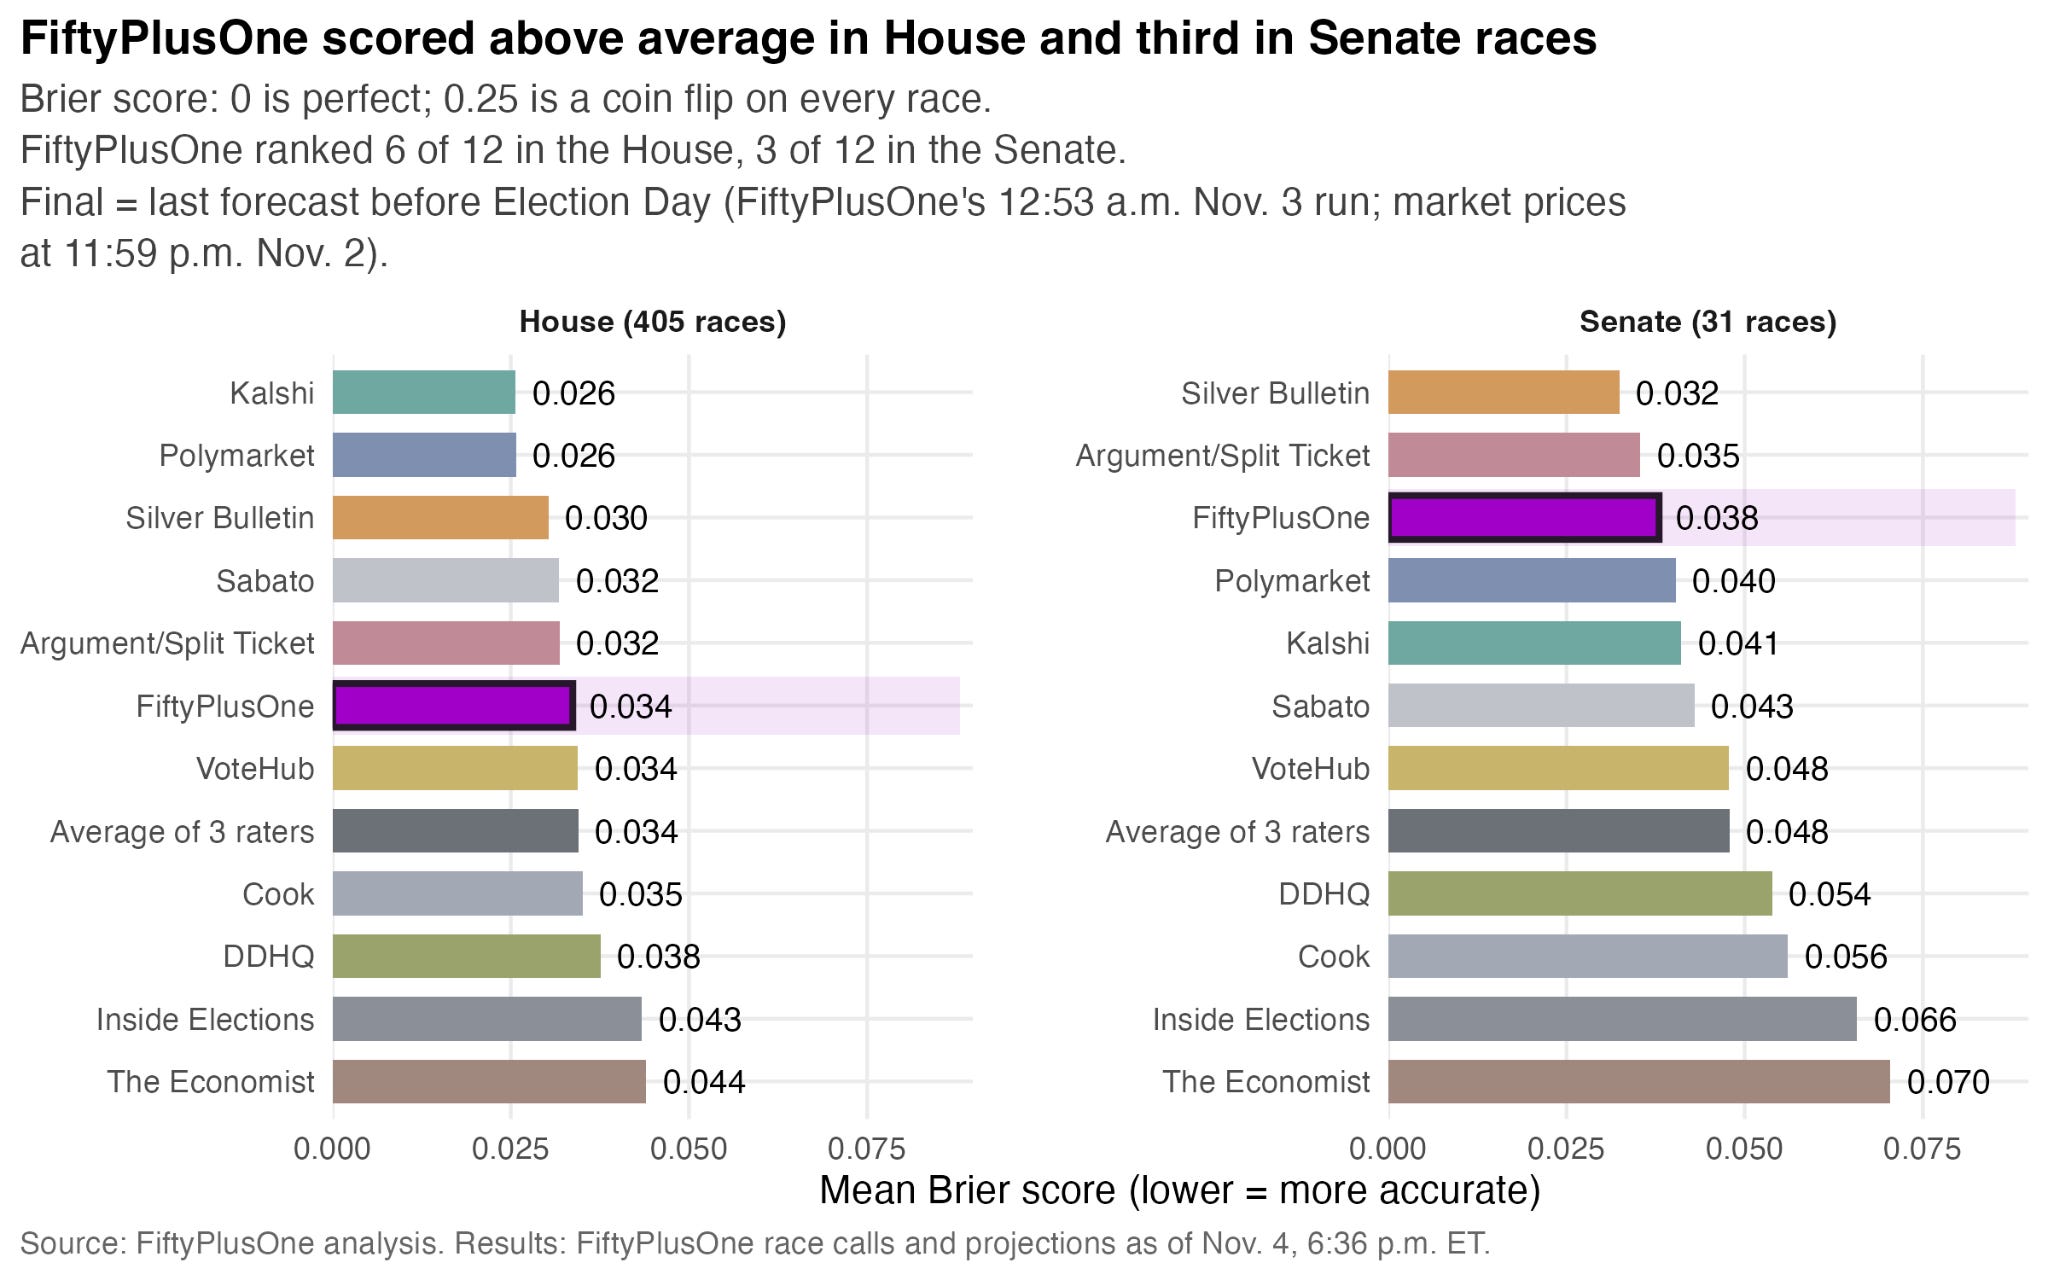
In the Senate, we ranked third of 12, behind Silver Bulletin and Split Ticket. We beat both markets, all three race raters, DDHQ, VoteHub and The Economist. The House was our weaker chamber; FiftyPlusOne ranked sixth, at 0.034, out of 12 forecasters. The markets did best here (both 0.026), followed by Silver Bulletin (0.030), then Sabato and Split Ticket (both 0.032). But the top nine sources were separated by less than a hundredth of a point. These differences are pretty much meaningless statistically.
We called 31 of 32 Senate races right (so far)
Forget probabilities for a second. One of the big questions consumers of our forecasts will want to know the answer to is whether the candidate we gave a higher chance of winning actually did. The graph below reports the accuracy of our House and Senate model calls, in races that are currently reporting or aren’t currently too close to call (about a dozen House seats, plus the Senate races in Mississippi and Alaska).
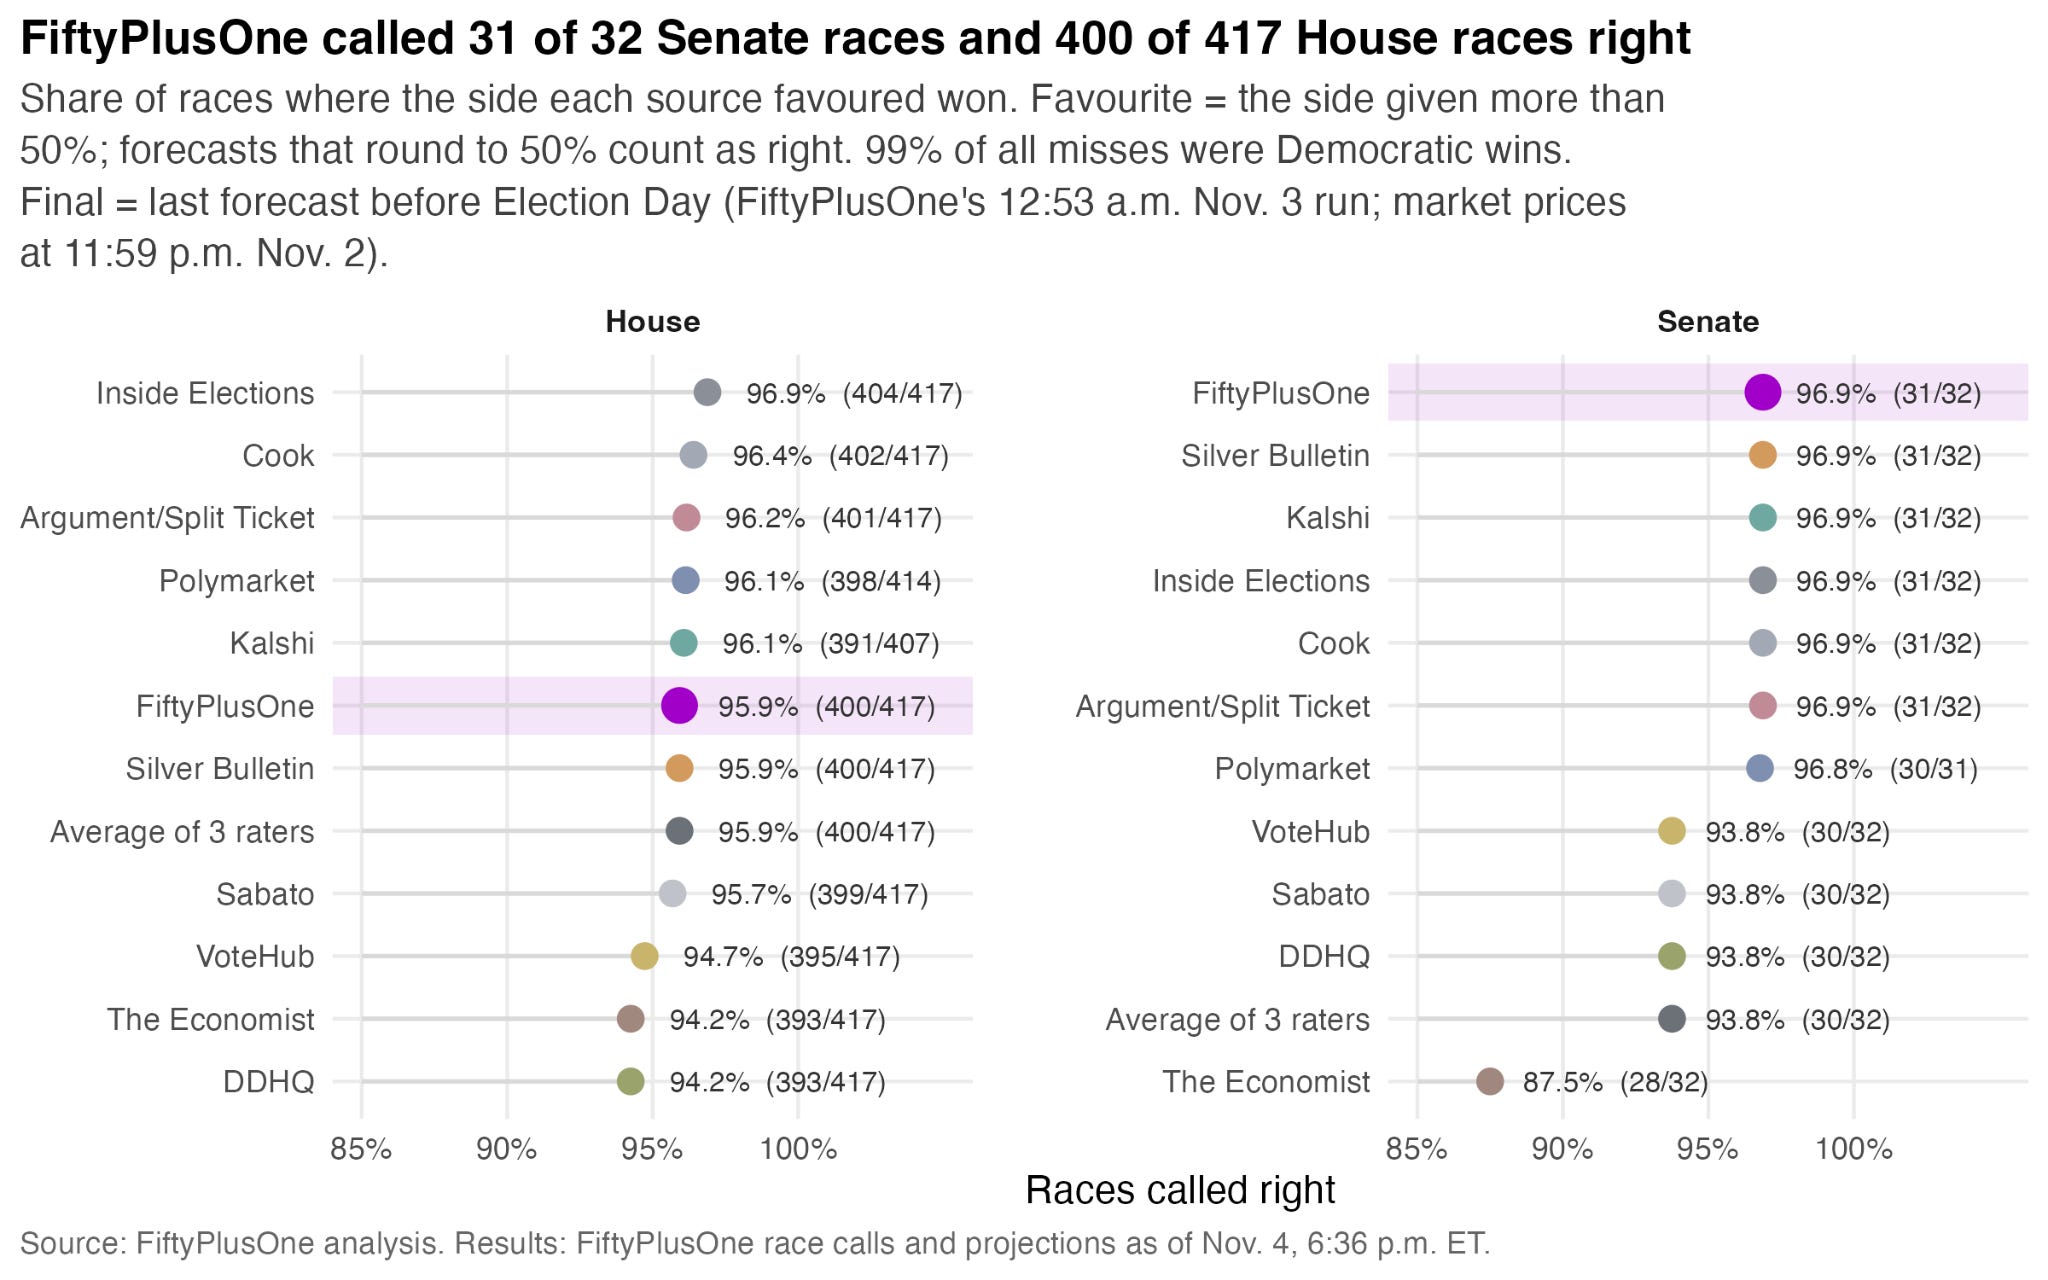
In the Senate, we called 31 of 32 races correctly, tied for the best of any source. In the House, we called 400 of 417 races correctly, or 96 percent, the same as Silver Bulletin and just 0.2 percentage points below the most accurate quantitative forecaster on this metric, Split Ticket. Inside Elections led the pack with 404 correct calls, at a 96.9 percent accuracy rate. Notably, every one of the 237 House seats where our model favored the Democrat went to a Democrat.
FiftyPlusOne had the lowest error predicting candidate vote margins in the House and Senate
So far we have looked at accuracy only in terms of probabilistic calibration. But a good forecast will also predict attitudes well.
The FiftyPlusOne forecast excelled, relative to the competition, at producing forecasts with low error.
The chart below shows projected Democratic margins from each forecast versus actual results in 411 races that have been called for either party as of 6:36 p.m. ET on Nov. 4.
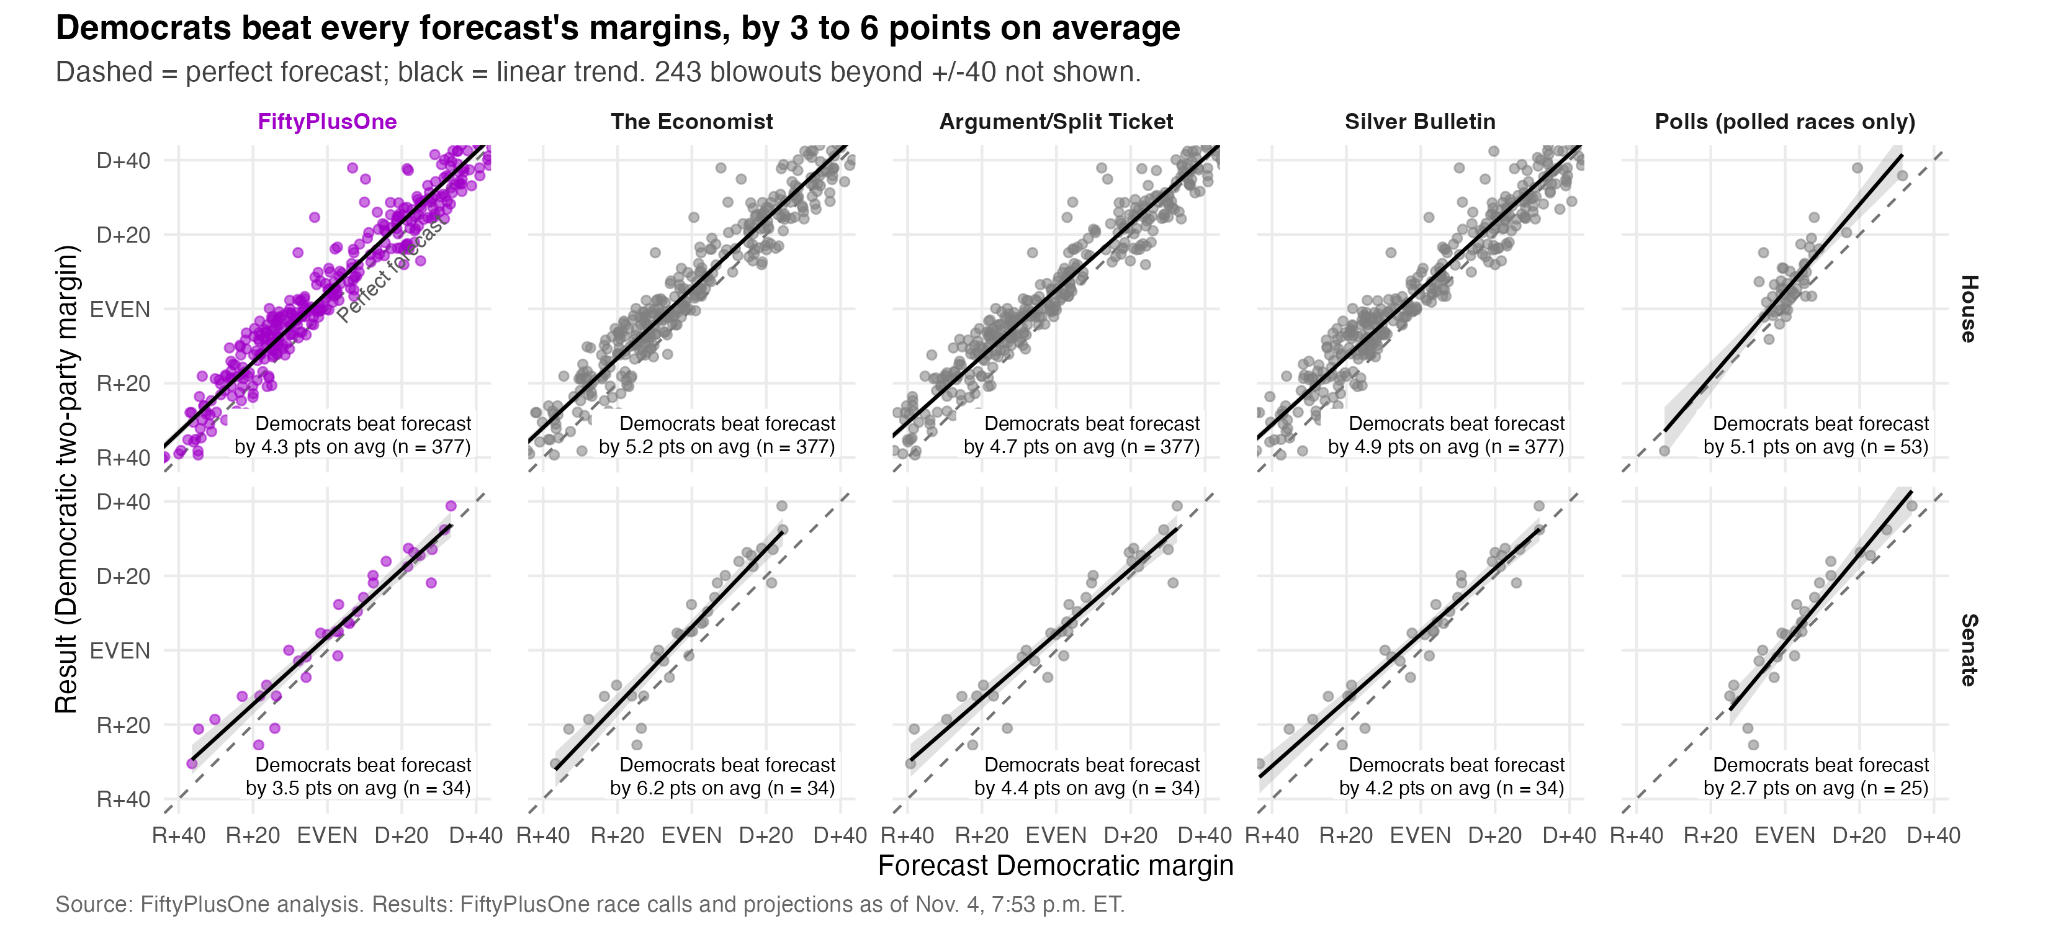
Across forecasters, Democrats beat their predicted margins by an average of 5 points in the House and 4.8 points in the Senate. In the FiftyPlusOne forecast, our average error was 4.3 points in the House and 3.5 points in the Senate, lower than every other forecaster.
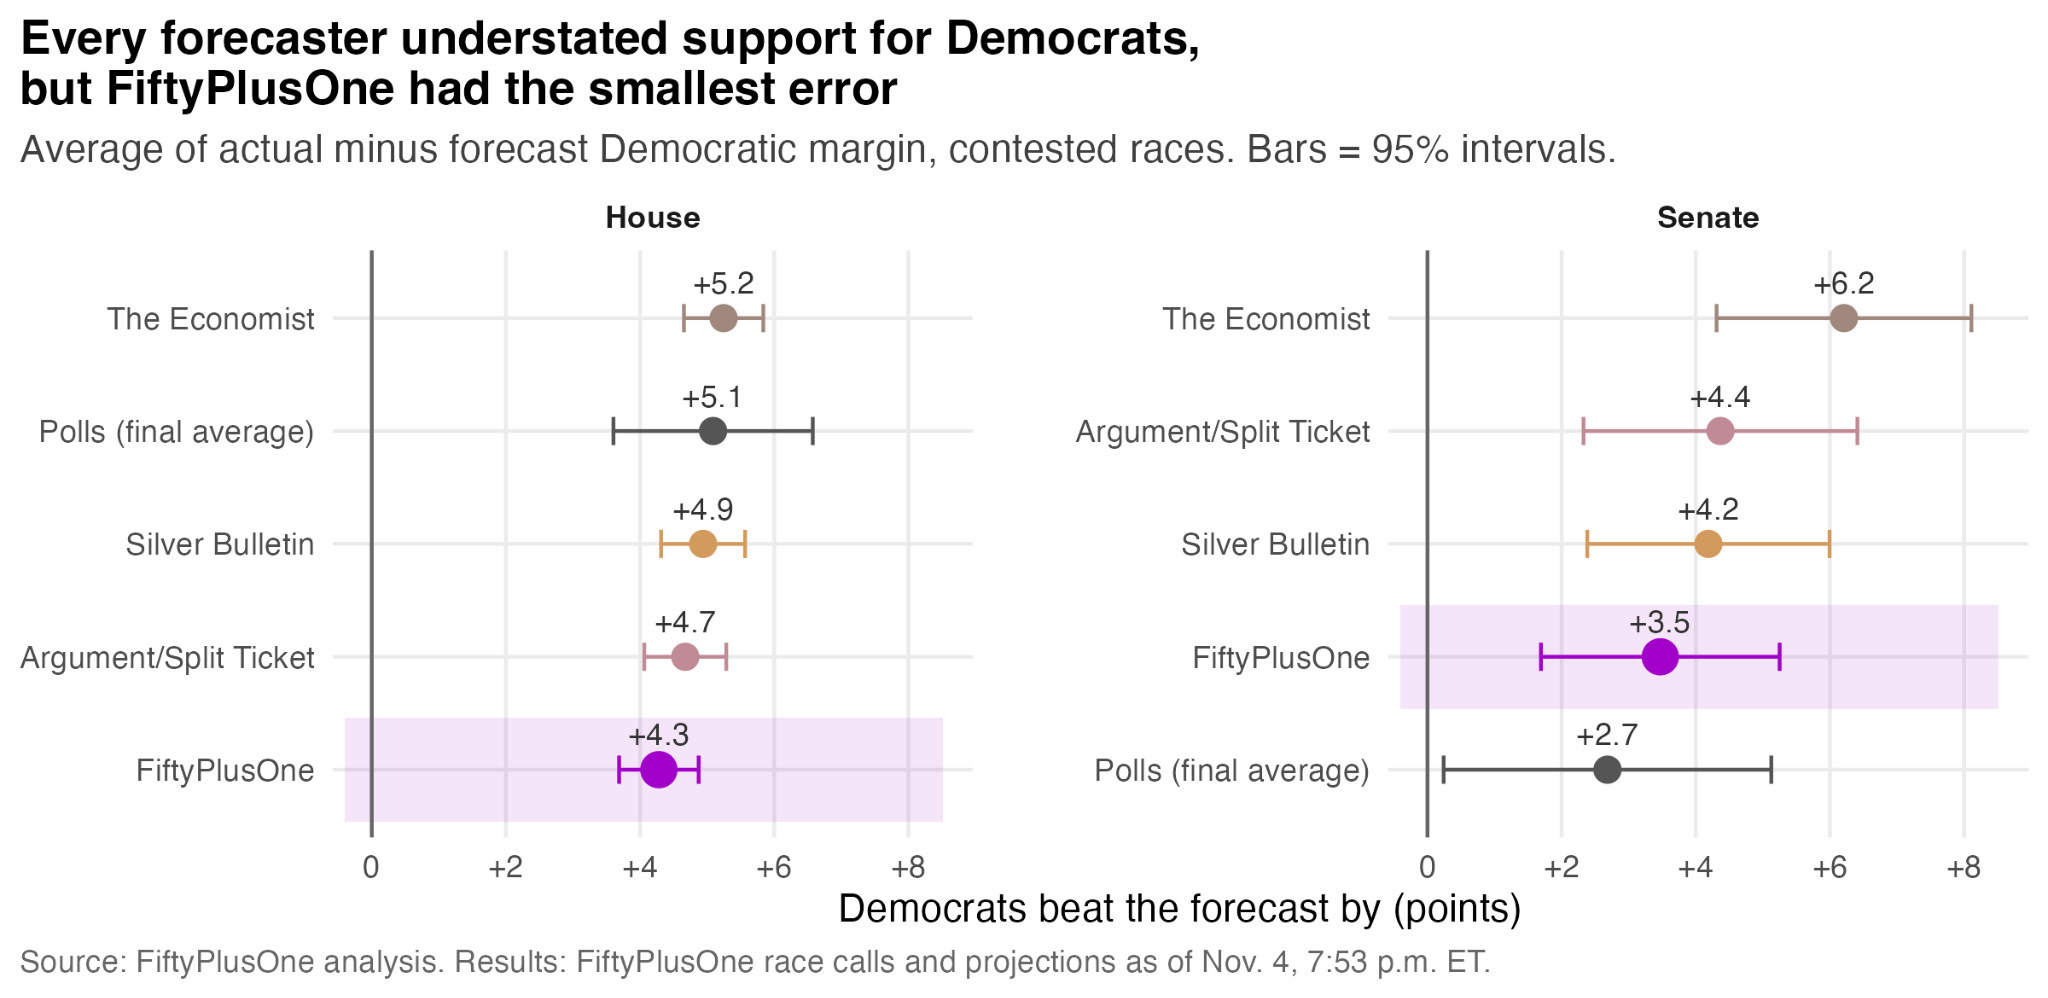
Across 377 contested House races, Democrats beat our predicted margins by 4.3 points on average, vs 4.7 for Split Ticket, 4.9 for Silver Bulletin and 5.2 for The Economist. In the Senate, Democrats beat our margins by 3.5 points, vs 4.2 for Silver Bulletin, 4.4 for Split Ticket and 6.2 for The Economist.
FiftyPlusOne is the most accurate forecaster in 2026, in terms of projected win margins in called seats.
FiftyPlusOne understated Democrats’ final seats, but did better than professional ratings firms
Democrats have won or are projected to win 255 House seats and 55 Senate seats. How likely did that look on the eve of the election?
Our final forecast gave Democrats a 10 percent chance of winning 255 or more House seats and a 21 percent chance of 55 or more Senate seats. Our median outcome was 239 House seats and 53 in the Senate.
Here I will compare our forecasts to those from the expert race raters at Cook Political Report, Sabato’s Crystal Ball, and Inside Elections. The race raters don’t publish probabilities, so their answer depends on how you translate their labels into probabilities. Taken literally (a “toss-up” as a coin flip, a Lean as something between a 60-75 percent shot — the average of Cook, Inside Elections and Sabato gave Democrats just a 4 percent chance of 255 House seats and a 16 percent chance of 55 Senate seats.
By comparison, the FiftyPlusOne model gave Democrats a 10 percent chance of winning 255 or more seats (with its median of 240). The Economist had this outcome outside or right at the edge of its 95 percent uncertainty interval. We gave the Democrats a 21 percent chance of winning 55+ seats. The outcome in the upper chamber was surprising, but not unforeseeable by our model.
The raters did say their toss-ups would probably break toward Democrats. And historically, they have. At 45 days out, House toss-ups have gone to the party out of power about two-thirds of the time in past midterms (Senate toss-ups break to the out-party a bit more than half of the time). If you credit the raters with that record and their average rises to 13 percent and 29 percent, a bit above ours.
But that’s a correction we’d be making for them. If raters really wanted to communicate that toss-up seats leaned Democratic this year, then they would have called them Lean Democratic. For the curious, here’s how much the raters’ odds move depending on how you read their labels.
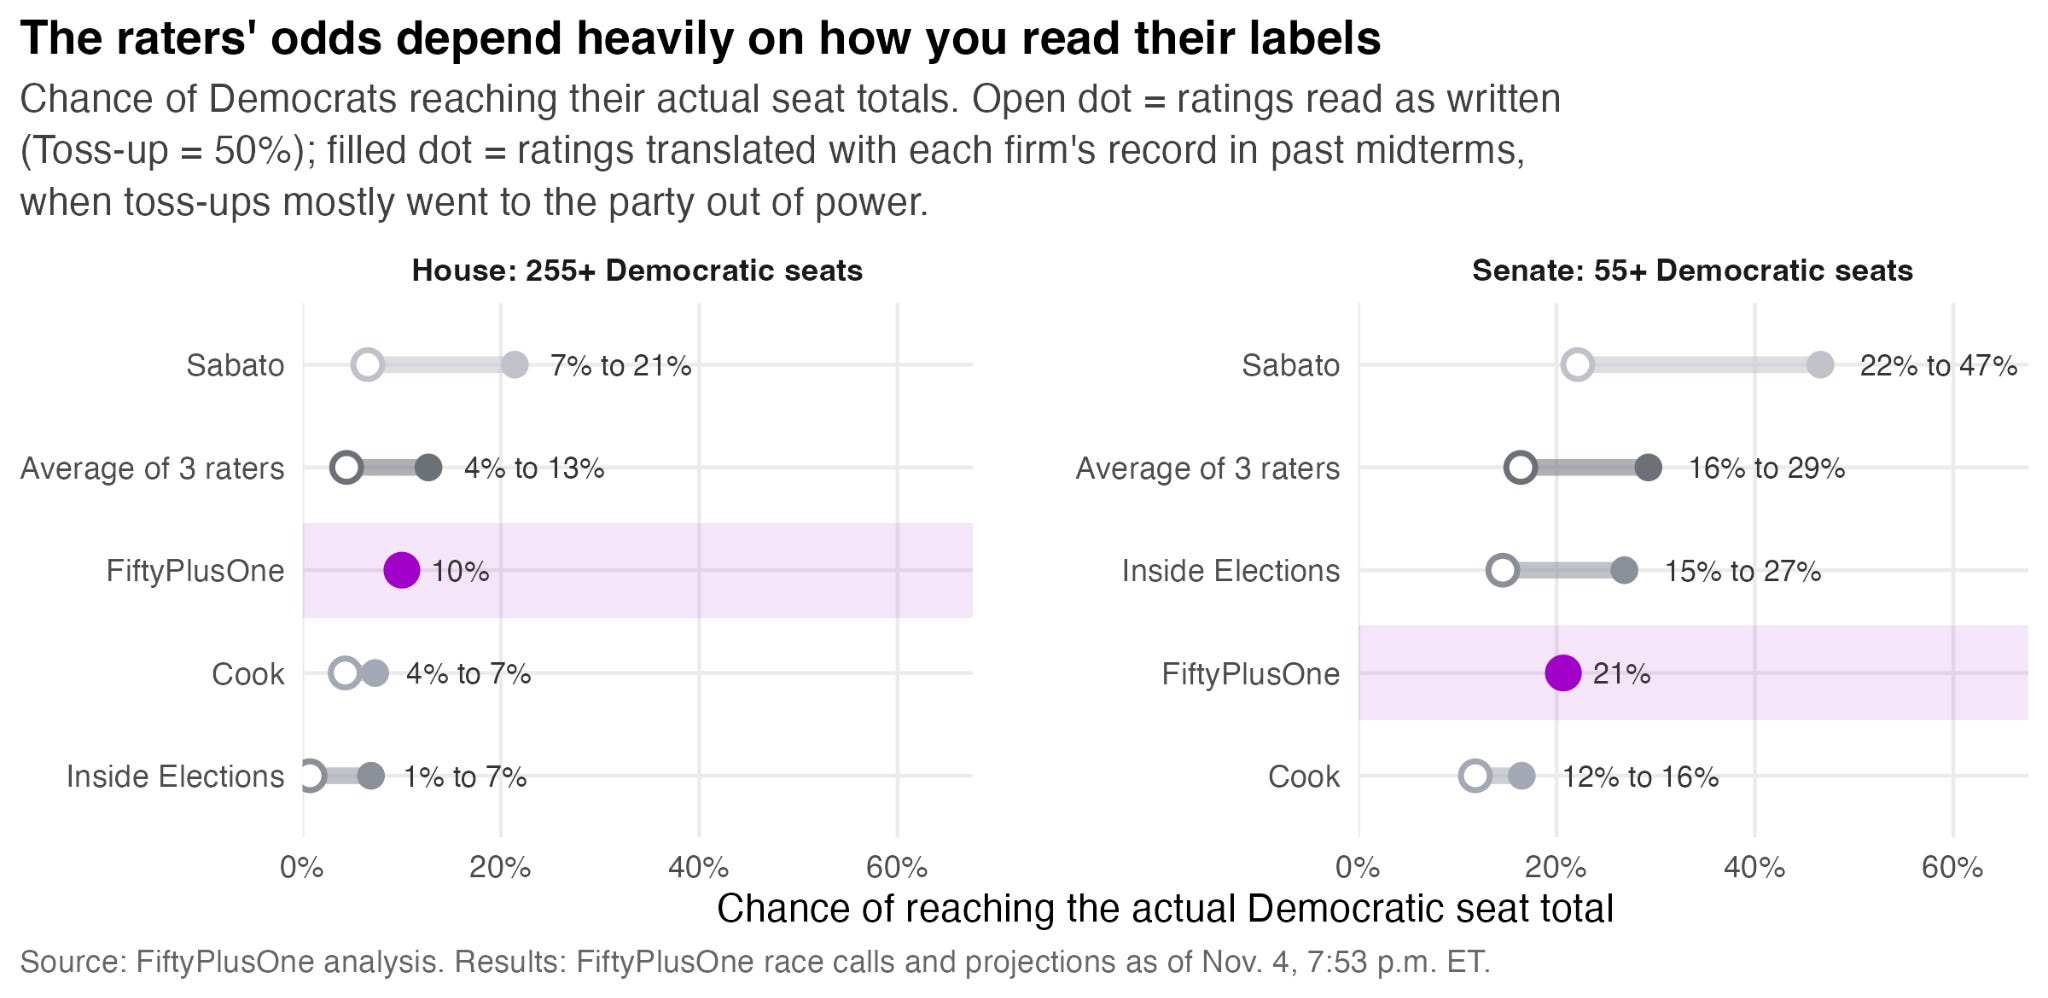
The exception to this is Larry Sabato’s Crystal Ball at the University of Virginia’s Center for Politics. When we apply our method for translating race ratings to distributions of outcomes, Sabato’s race ratings implied a 22 to 47 percent chance of Democrats winning 55+ Senate seats, and a 7-21 percent chance in the House.
But the numbers above are for the expert handicappers on the last day of the election. Yet they spent much of the cycle seeming to be bearish on the Democrats’ ability to win any meaningful majority of seats. In August of this year, when the FiftyPlusOne was assigning a probability of Democrats taking the House in the mid-80s, Charlie Cook wondered whether there were enough defectors in the electorate for the Democrats to even win the Senate at all. Then, the race raters, on average, were projecting Democrats to lose the House, if you read ther ratings as literal descriptions of win probabilities.
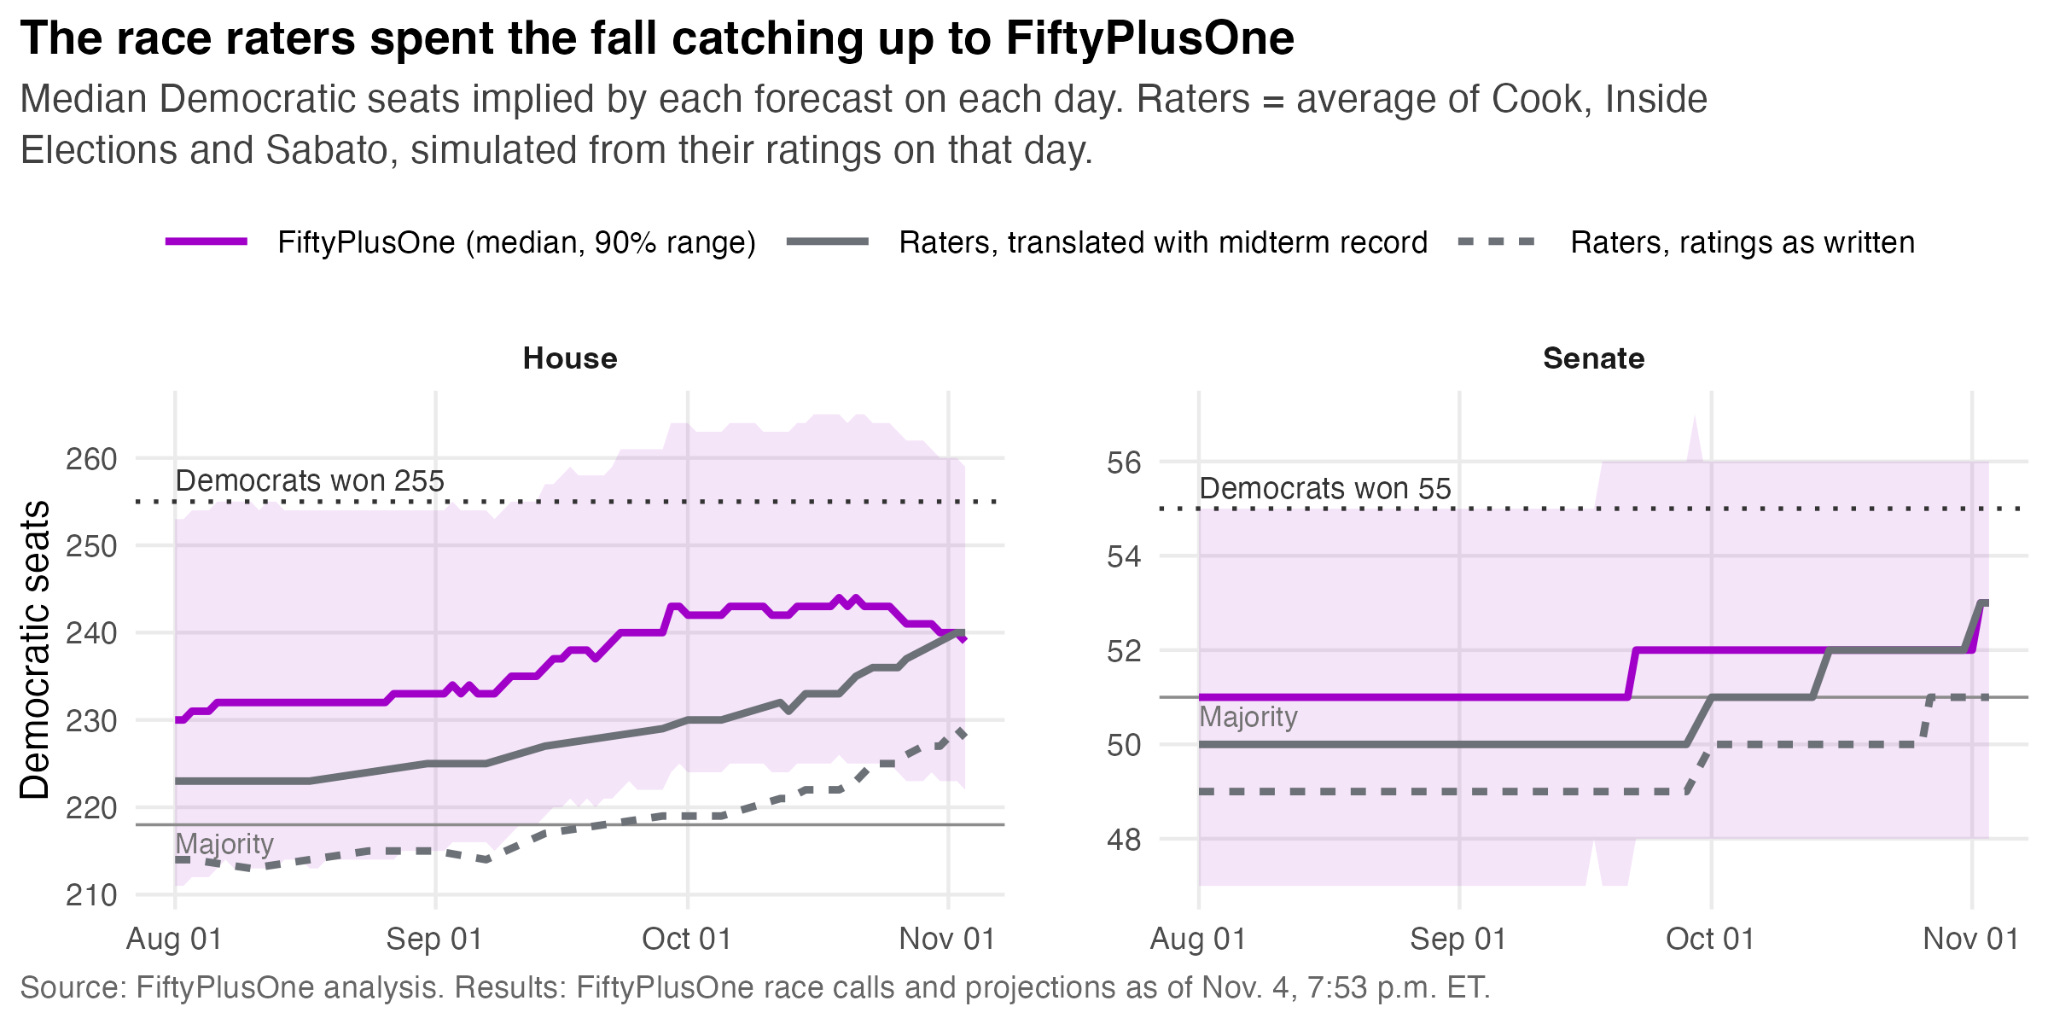
On Sept. 1, the average of the three raters implied a median of 215 Democratic House seats — short of a majority — and just a 41 percent chance Democrats would take the House. Our model had Democrats at 233 seats and a 92 percent chance. In the Senate, the raters implied 49 Democratic seats and a 32 percent chance of control. We had 51 seats and 56 percent.
By Oct. 1, we were at 242 House seats and a 99 percent chance of Democratic victory. The raters, read literally, were at 219 and 56 percent.
They moved a lot after that. Cook, Inside Elections and Sabato made dozens of rating changes in October, nearly all toward Democrats, and by Election Day their ratings implied 228 House seats and a 75 percent chance of a Democratic majority. That’s a big jump. But they never got to where our model had been since September.
Even if you translate the ratings using the raters’ midterm track record, which gives them credit for the late break they are always hesitant to embrace, they implied just 225 House seats on Sept. 1 and 230 on Oct. 1. Their probability of taking the chamber didn’t catch up to our House forecast until Nov. 2, the day before the election (helped a little by our own median slipping from 244 seats in mid-October to 239). At least in terms of aggregate probability, our model saw the Democratic tsunami two months before the experts did.
Where we missed
To be sure, the Democratic beat in the House was very large, and something few talked about before the election In North Carolina, the new district lines left several seats — NC-6, NC-9, NC-13 and NC-14 — with little or no public polling, and we gave Democrats between 4 percent and 12 percent chance of winning in each. As of writing, it looks like Democrats will win all four. In Texas, our worst miss was TX-9, where we had the Democrats at 7 percent. Democrats also won TX-15 and TX-23 in heavily Hispanic South Texas.
Due to a lack of polling and a lack of good Hispanic samples in Texas House districts, our model underestimated how far voters in redrawn and heavily Hispanic districts would swing toward Democrats. The markets did better on those seats. And while we beat them on who would control the House, they expected Democrats to win a few more individual seats than we did (and they were closer on the size of the majority).
This is why you assume polls will be unbiased and explore error in both directions!
Throughout the election cycle, one question kept coming up from our subscribers: Will the polls underestimate Republicans again?
It’s a fair thing to ask. Polls of House and Senate races underestimated Republicans in 2014, 2016, 2020, and 2024. In 2020, they missed by 6 to 7 points on margin.
But as we wrote, the correct thing to do historically was to assume polls would be unbiased on average, and explore what would happen if they were off in either direction. In 2012, House and Senate polls underestimated Democrats by 3 to 5 points. In 2018 and 2022, they were close to dead on. (2022 is a good reminder: the polls were fine, and it was the punditry predicting a red wave that missed.) And this year the polls missed the other way. Democrats beat their final polling averages in House races by about 5 points.
This is a big reason — maybe the big reason — why our forecast worked so well this year. Because the FiftyPlusOne model took seriously the possibility that polls would understate support for Democrats, a 255-seat Democratic House was well inside our range of outcomes. And our confidence in Democrats’ path to victory in both chambers proved to be correct.
Based on the analysis above, we will be making some tweaks to our forecast, and especially figuring out how to incorporate demographic data from national polling crosstabs that could sharpen our forecasts in individual districts. Our crosstab-level generic ballot averages proved to be remarkably accurate and, in some post-hoc estimation, would have predicted a Democratic House majority of 245 seats.
But one thing we won’t be doing is messing with our assumptions about the historical distribution of polling error. That was lies unskewing.
Thank you to everyone who read FiftyPlusOne’s forecast this election season. We will certainly be back for the next one. In the meantime, you can continue to find our aggregation of polls of presidential approval, party favorability ratings, and, soon, the 2028 presidential primaries, at FiftyPlusOne.news.
Paid subscribers to 50+1 get access to premium analysis, plus sortable tables and complete data access on our polling website. If you want to follow the 2026 cycle with the best data at your fingertips, become a paid subscriber.
Methodology
Results: Race calls and projections as of 7:53 p.m. ET on Nov. 4. Races neither called nor projected aren’t scored. Margins use FiftyPlusOne’s projected final two-party margin for each race, which accounts for votes still to be counted; races decided by more than 60 points, including uncontested races, are left out, leaving 377 House and 34 Senate races. Montana’s Senate race is excluded because the Democratic side was split between two candidates.
Across models, “final” means the last forecast before Election Day: FiftyPlusOne’s 12:53 a.m. ET run on Nov. 3, and prediction market prices as of 11:59 p.m. ET on Nov. 2. Market data come from the public Kalshi and Polymarket APIs. Other forecasters’ final race and chamber probabilities were compiled by hand from their published forecasts.
Race-rater ratings from Cook, Inside Elections, and Sabato’s Crystal Ball are converted to probabilities using a simulation model that applies a random variable with a one-standard-deviation of 0.99 national shift to all ratings on the log-odds scale, which was estimated from past midterms added to every competitive rac