



Today, FiftyPlusOne released our new forecasting model for the U.S. House and Senate midterm elections.
As of 6:00 AM Eastern on Monday, August 3, 2026, the model gives Democrats an 85% chance of winning the majority of seats in the House, and a 55% chance of winning control of the Senate (51 seats or more, unless an independent wins in Nebraska, Montana, Idaho, or South Dakota). Our median forecast House popular vote margin for the Democrats is +7 points, plus or minus 5, and we forecast the party to win a median of 230 House seats (a range of 211 to 253) and 51 Senate seats (47-55).
None of this is a prediction that Democrats will win, but rather a probabilistic statement about the future if typical predictors of election results are as accurate (or inaccurate) as they have been historically. Our model generates a range of plausible outcomes for each chamber based on how often parties with similar polling leads as we’re seeing for Democrats today have gone on to win elections in the past. You can think of our forecast as an answer to the question “When Democrats have led the generic ballot by 6 points in August while Republicans have held the White House and [House/Senate] polls looked like they do now, how often have they won control of the [House/Senate]?”


This forecast is the intellectual successor to the congressional forecasting model I built at FiveThirtyEight in 2024 — which was the most accurate of any statistical forecast model last cycle and even beat the prediction markets. Our forecast combines polls, district- and state-level fundraising and past election returns, candidate-level data, and ratings from expert race-raters to produce a probability that either major party will win either chamber this November. (I say intellectual successor and not direct successor because I have had to build a new model from the ground up.)
If you would like to learn more about how the model works, you can find a methodology explainer here. (Though reader beware; we have erred on the side of verbosity.) A few highlights from the model follow.
FiftyPlusOne is aggregating polls and calculating polling averages and election forecasts for nearly every major statewide and federal election. Subscribe so you don’t miss out:
1. Democrats are even better positioned than they were before the 2018 wave
We ran our forecasting model on the 2018 cycle using only the data that existed at this same point on the calendar, 92 days before Election Day, and compared it to today. It may come as a surprise to readers to learn that Democrats are even likelier in our model today to win control of the House than they were at this point in 2018, the canonical “blue wave” cycle. At this point in 2018, our model would have given Democrats a 76% chance of winning control of the chamber.
The party back then was running about 6 points ahead in the polls, as it is today, and we were also forecasting it to win 230 seats in the chamber, identical to today’s forecast.
So what changed? Mostly, the geography of competition. Compared to 2018 there are more Lean Republican seats for the Democrats to pick up — and fewer Lean Democratic seats for them to lose. Our forecast also has less uncertainty now, owing to higher polarization of elections. The combination is that in 2018, at this same point, our model saw a wide spread of outcomes: anywhere from 201 to 264 House seats. Today that spread is meaningfully tighter, at 211 to 253 Democratic seats — with far more simulations where Democrats clear the 218 seats needed for the majority.
2. A friendly map is not enough to save Republicans in the Senate
Despite the fact that most Senate seats up for grabs were won handsomely by Donald Trump in 2024, these races have turned out to be marginal in our election forecast. This is because a forecasted D+7 popular vote margin for the Democrats puts them within reach, and recruiting successes for the party have pushed them further into play.
Take the six seats most likely to decide the chamber. If you combine each state’s partisan lean — a measure of how friendly it is to Democrats/Republicans in a neutral year — with the current generic-ballot margin, four of them still lean Republican, by an average of 6 points. That’s Alaska, Iowa, Texas, and Ohio — in that order. (In North Carolina and Maine, Democratic candidates are favored with this simple formula.)
Yet in every one of these races but Maine, the actual polling has Democrats running well ahead of where the map says they should be. In Texas, for example, the lean and the environment together say the Republican candidate, Ken Paxton, should be ahead of Democratic challenger James Talarico by up six points. Yet the polls have the latter ahead by three. In Alaska, Ohio, and Iowa, polls tell pretty much the same story, with Democratic candidates polling seven to nine points to the left of their states’ partisan baseline.
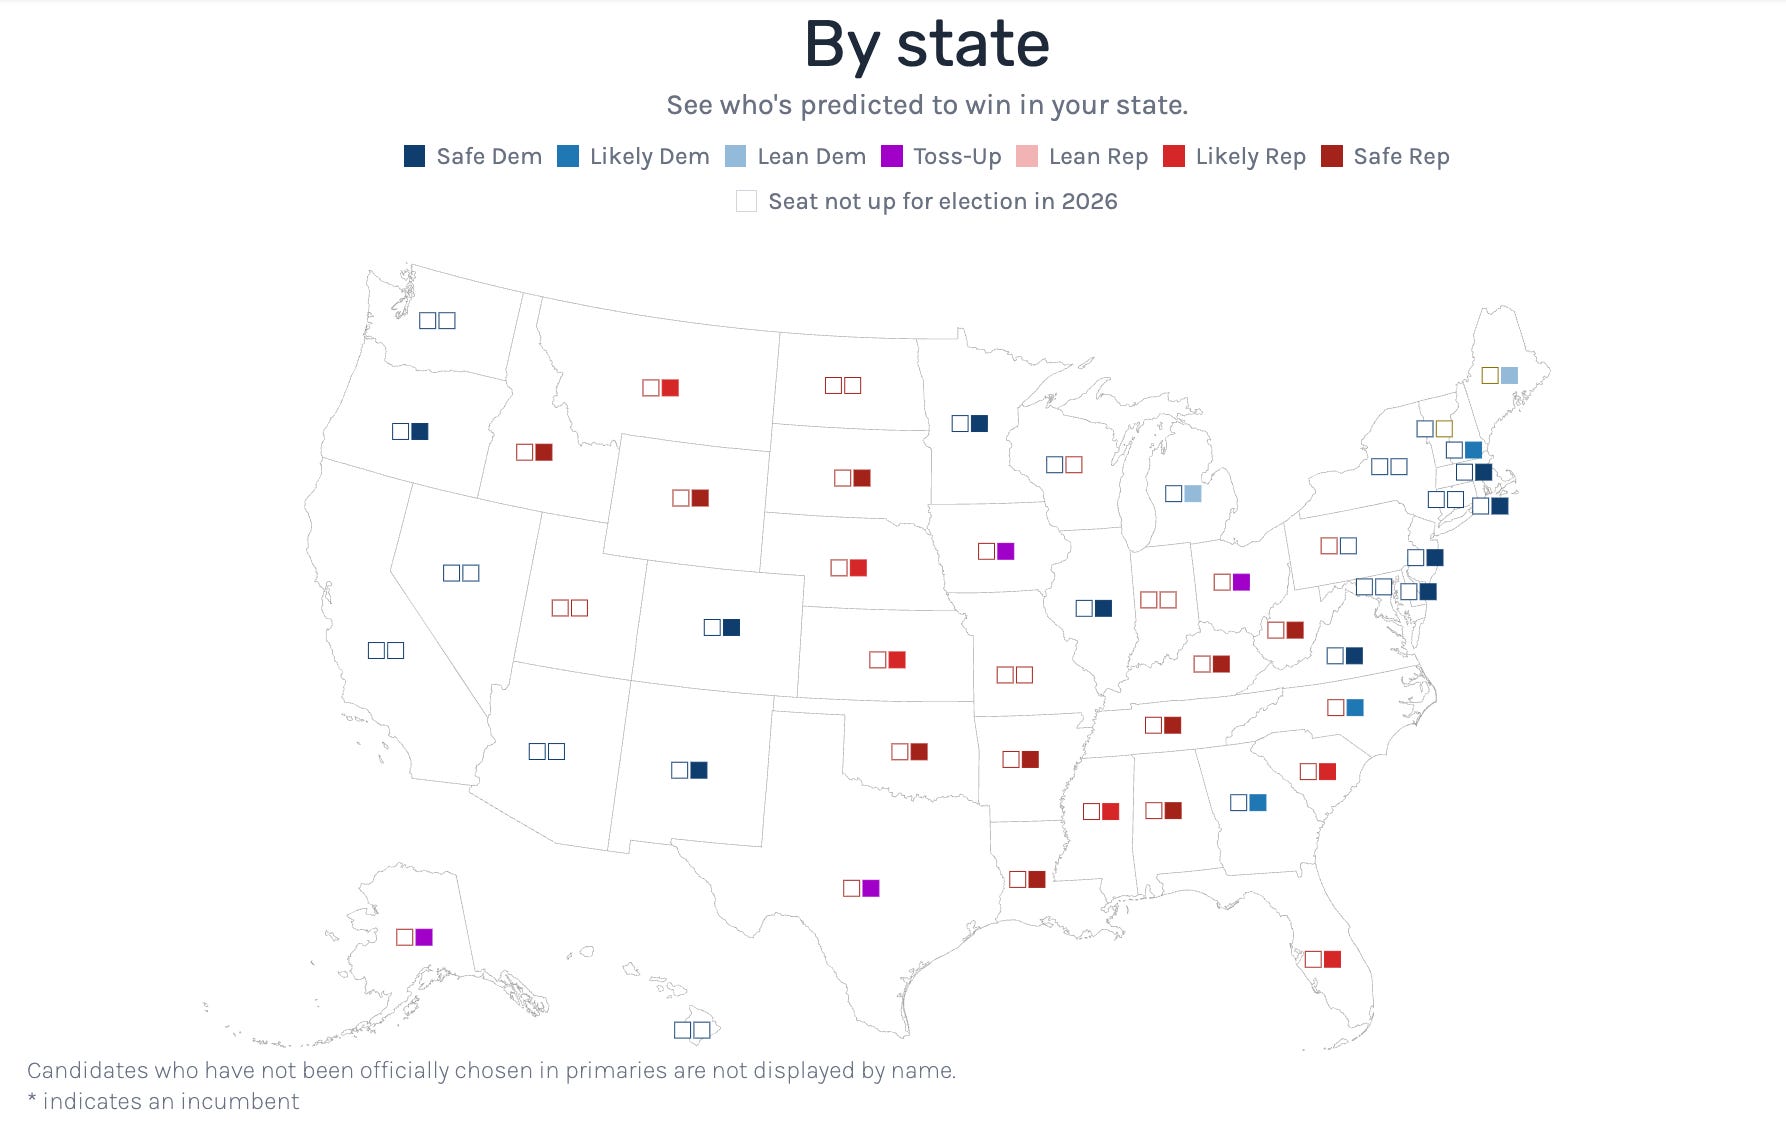
The one exception in in Maine, where Susan Collins’s decades-long personal brand keeps her about ten points ahead of a state that otherwise leans sharply Democratic. Still, polls there lead toward challenger Troy Jackson by 3-4 points.
Early Senate polling is thin and tends to tighten by November, so our model doesn’t take these leads at face value — but a gap this consistent is a real signal that strong Democratic recruiting has put these seats in play.
3. Democrats sweep both chambers about half the time
One cool way our model works is that the House and Senate are predicted simultaneously, in one combined model. This innovation in forecasting (most modelers forecast the two separately) gives us the ability to calculate the “joint probability” that Democrats sweep both the House and Senate in November.
The chart below shows all 40,000 of our model’s simulated elections as of publication, lined up along the horizontal axis by the Democrats’ margin in the national House vote and colored by who controls Congress in each simulation. Because we simulate the two chambers together, we can just count the outcomes for each national popular vote: Democrats win both chambers in 53% of simulations (dark blue); they take the House but fall short in the Senate in another 33% (light blue) — the likeliest path to divided control; Republicans hold both in 12% (dark red); and the rarest result of all — a Republican House alongside a Democratic Senate — turns up just 2% of the time (salmon).
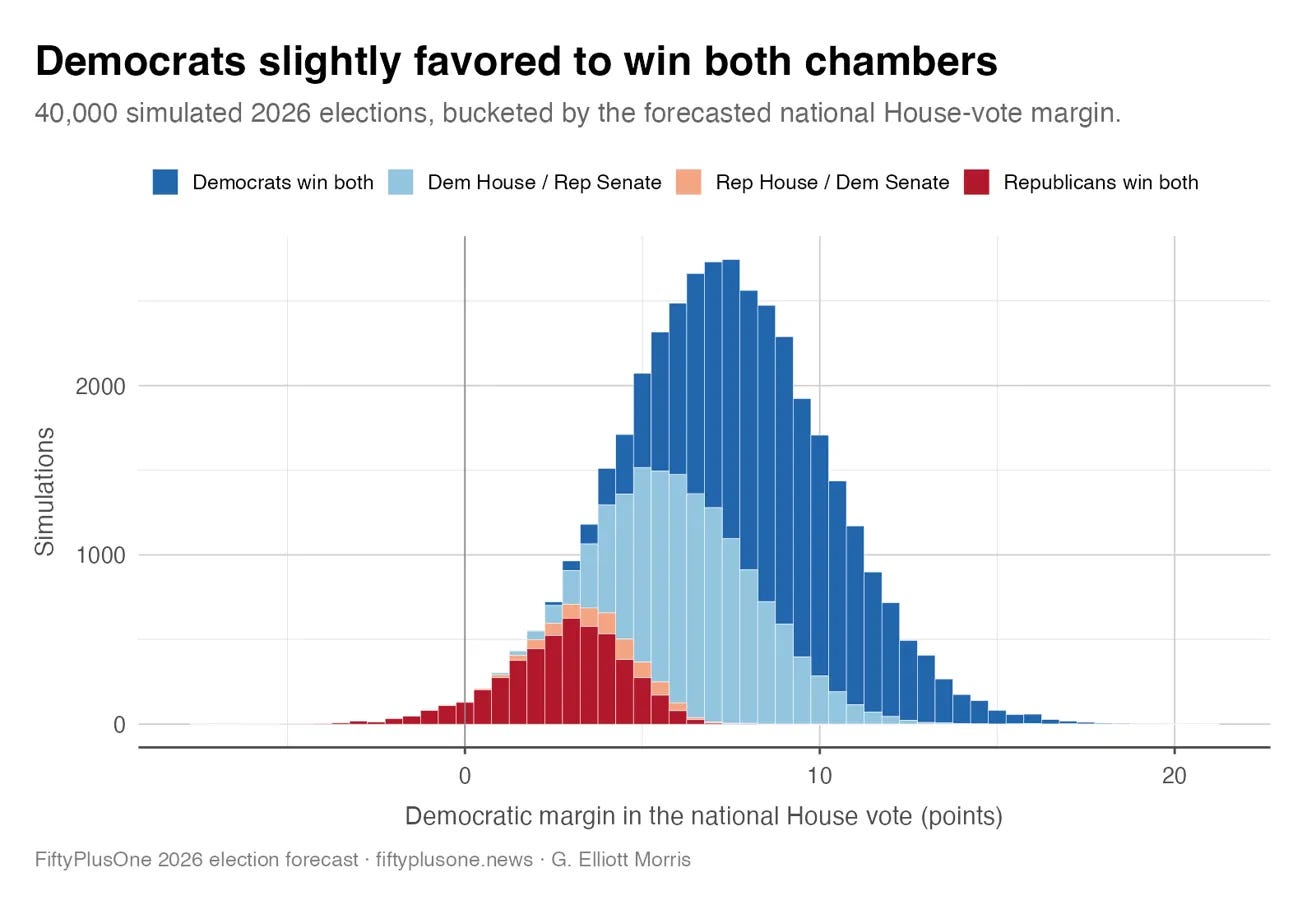
The map also gives us a good mental benchmark for what Democrats need to hit in the national popular vote to be favored to win both chambers. When Democrats win the NPV by less than about 3.5-4 points, they're underdogs to hold the House at all and unlikely to take the Senate. Between roughly 4 and 6-7 points, they are likely carry the House but Republicans keep the Senate. Once Democrats cross a threshold of about 6-7 points in the NPV, they are favored to win both chambers.
Today’s forecast — a Democratic edge of about 7 points — sits right on that upper boundary, which is why full control is at a pure toss-up in our model.
4. Our track record is very good
Lastly, as I mentioned, the models I have built to forecast congressional elections in the past have been very well calibrated — so much so that betting on them in prediction markets would have netted you money. (This is not financial advice.
This year, we built a very extensive set of backtesting programs to understand how our model would have behaved in past elections, trained only on the data that would have existed before those contests. The results are shown here:
While backtesting does not guarantee future performance, the fact that the model behaves well on out-of-sample data gives us confidence in its explanatory and predictive powers on future elections. Our model’s conclusions are roughly in line with those of other high-caliber statistical forecasters (including where I used to work).
. . .
That’s it for now, but expect more coverage of our forecast on this Substack regularly in the weeks to come. You can find the latest odds here and explore our polling averages for general elections to the House, Senate, and governorships here.
Paid subscribers to 50+1 get access to premium analysis, plus sortable tables and complete data access on our polling website. If you want to follow the 2026 cycle with the best data at your fingertips, become a paid subscriber.