

Do we really know who's leading the Texas Senate races?
Primary polls have historically been rather unreliable, and a surge in new primary voters means turnout assumptions matter more than usual


This analysis is free for all readers. Paid subscribers to 50+1 get full access to our interactive polling tables, detailed methodological breakdowns, and premium analysis of major races.
The first competitive primaries of the 2026 election cycle happen in under a week, on March 3rd. In Texas, Democrats and Republicans will determine which candidates they want to face off against each other in November’s election to the U.S. Senate — one of the contests that could help determine control of the chamber at this year’s midterms.
For a smart primer on the candidates and where they stand on the issues, we’d point you to the Texas Tribune’s voter guides for the Democratic primary and the Republican primary. But 50+1 is here for the polls. And, if you’re a consumer of polls (like we are!), then there’s very little hard data on what is going to happen.
Where the averages stand
On the Republican side, it’s a three-way race. Attorney General Ken Paxton leads with 32.1% in our polling average1, followed by incumbent Senator John Cornyn at 29.2% and U.S. Rep. Wesley Hunt at 19.8%. That’s a Paxton +3 margin — a reversal from earlier in the cycle, when Paxton led comfortably before collapsing in the polls around September, around the time that Hunt entered the race.
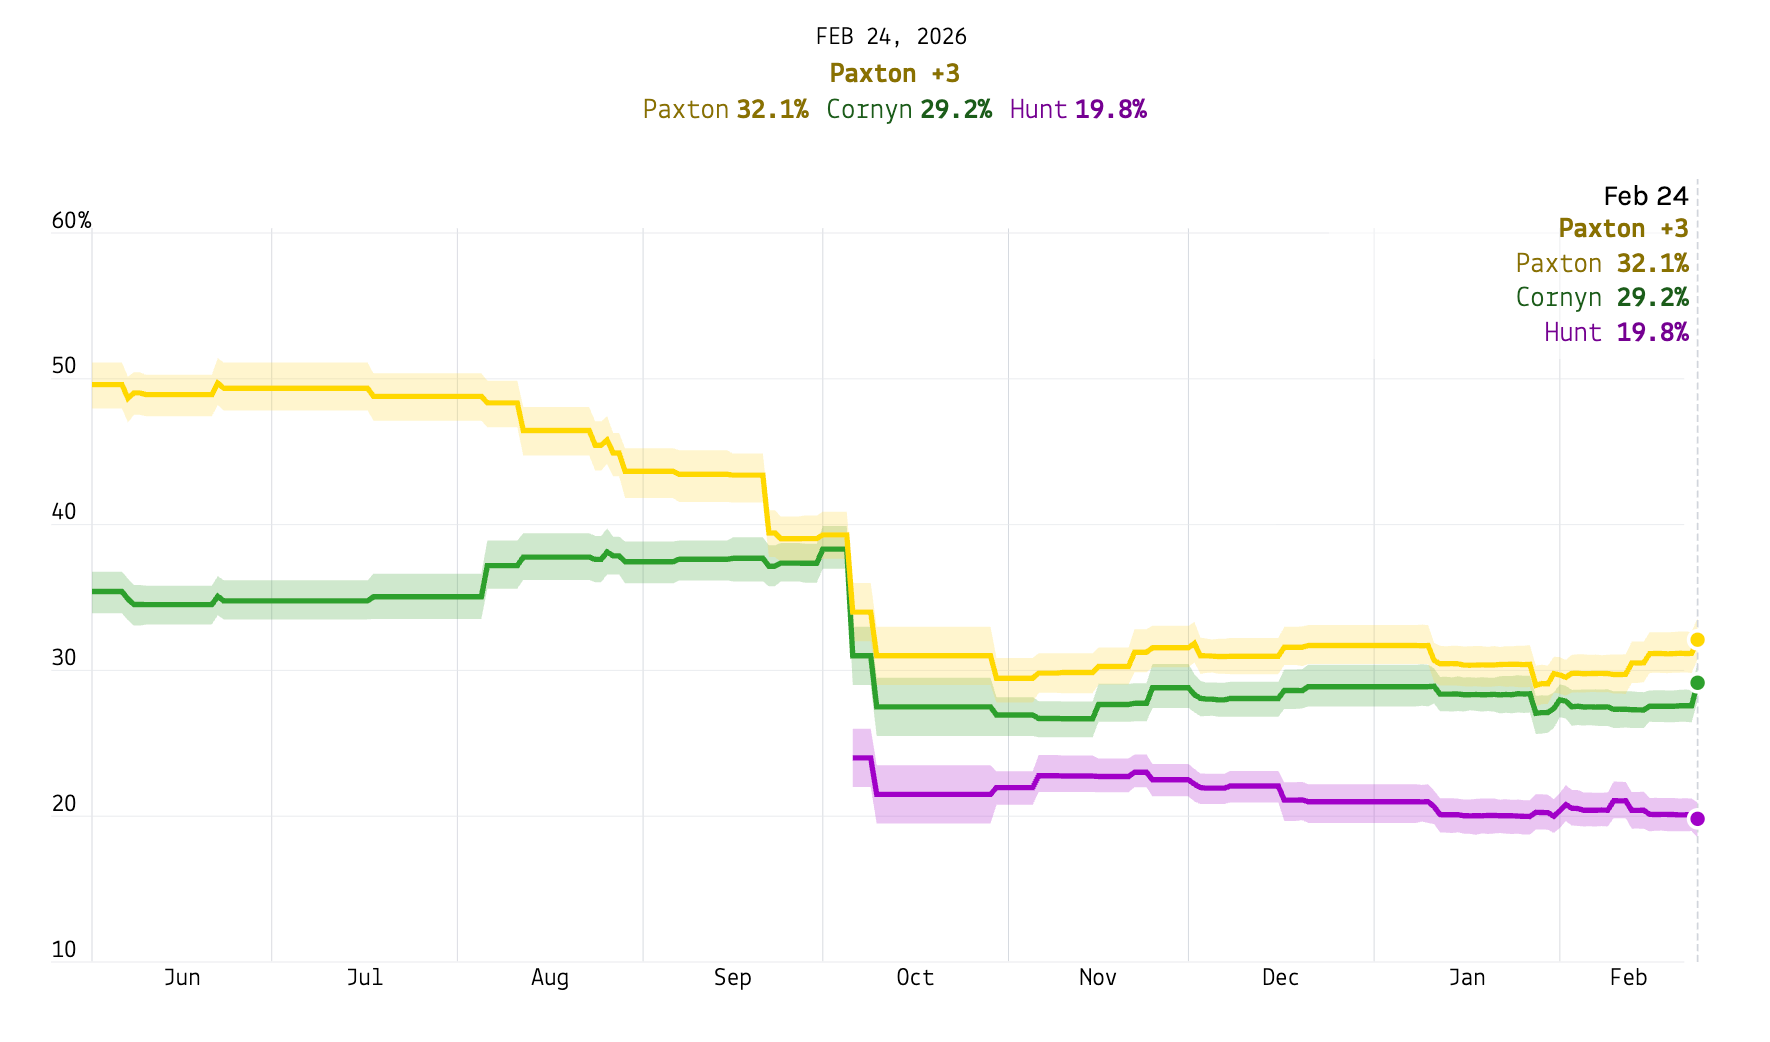
With no candidate likely to crack 50%, this race is almost certainly headed to a May 26 runoff between the top two finishers. One hypothetical poll of a runoff between Paxton and Cornyn shows Paxton leading 51% to 40%. Over the last year, our average shows that Paxton’s margin declined after Hunt entered the race, so it’s likely the U.S. House representative is pulling from Paxton’s “lane.”
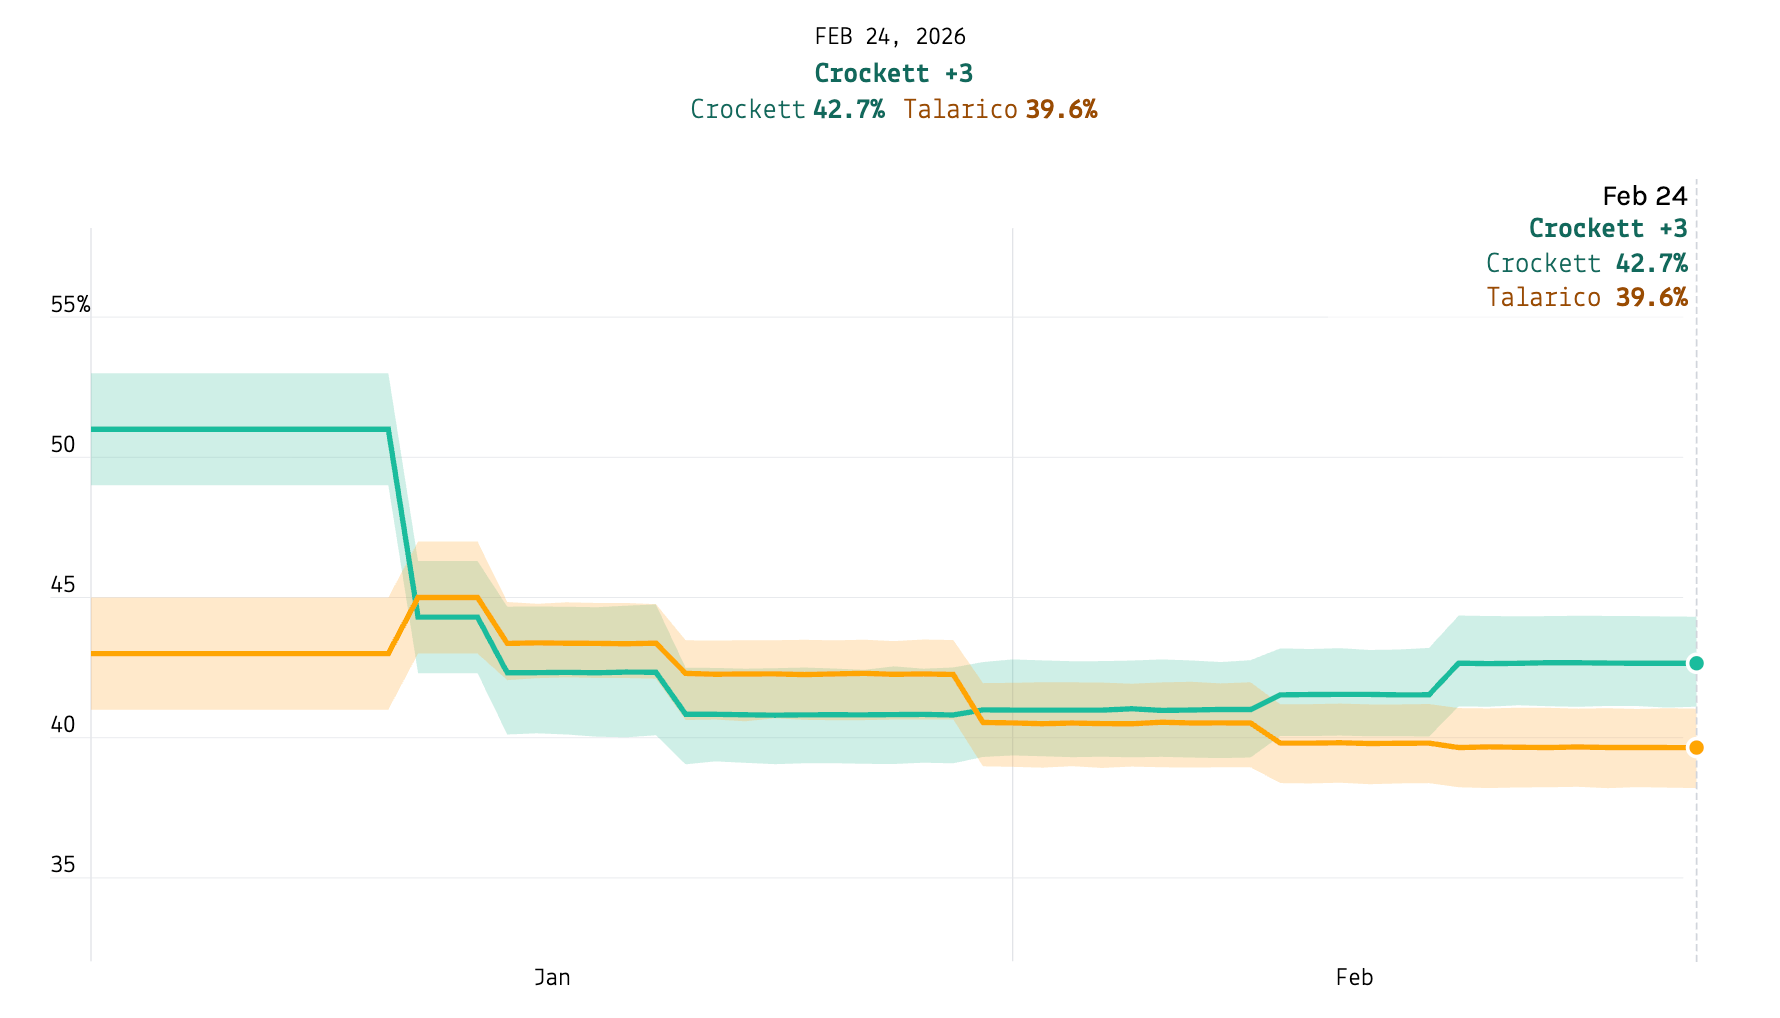
On the Democratic side, it’s a tight two-candidate contest between U.S. Rep. Jasmine Crockett and state Rep. James Talarico. In our average, Crockett leads in the polls by 42.7% to 39.7% — a margin of just 3 points, and well within the margin of sampling error for the polls provided.
Both races are close enough that the leader could easily lose, and in the Republican race, could even miss the runoff. And that brings us to the big caveat.
Primary polls are historically fairly unreliable
Frankly, you should rarely ever put too much stake into polls of primary elections. To put the averages above in the context of historical uncertainty in statewide primary polling, we looked at polls of Senate and Governor primaries held in 2014, 2016, and 20242 and calculated how accurate the polls were in each race. We computed a weighted polling average for 34 races (we only included contests where there were at least two surveys released in the last three weeks of the race), and the picture is, in a word, sobering.
At the individual candidate level, the historical error of statewide primary polling averages is 10 percentage points. That means a candidate polling at 31% could easily finish anywhere from the low 20s to the low 40s.
On the margin between the top two candidates — which is what we really care about in plurality races, like the Democratic primary in Texas — the numbers are even worse. The expected error on the margin between two primary candidates in a race for governor or U.S. Senate is a whopping 13.0 points. And in our historical data, polls picked the wrong winner for competitive primary races (those where the margin between candidates in polls was less than 10 points) in 2 out of every 10 elections. So both Crockett’s 3-point edge and Paxton’s 3-point advantage are well within the historical predictive margin of error for Senate primary polls.
But the average also obscures some truly enormous misses. In the crowded 2024 Nevada Republican Senate primary, polls had Sam Brown up 18 points on average over the last 3 weeks of the race; he won by 45. In the 2014 Iowa Republican Senate primary, Joni Ernst’s polling lead over her closest competitor was 16 points; she won by 38. And the 2024 Ohio Republican Senate primary polls showed a near-tie between Bernie Moreno and Matt Dolan; Moreno won by 18.
The 2024 cycle was also the least accurate of the three we studied, with an expected error of 16.1 percentage points on the margin of victory between the candidates polling in the top two. The 2014 cycle was the most accurate, at 10.8 points. Neither of these numbers should make you confident in a 3-point lead.
There are very few polls in either of these averages. The Democratic primary has only been polled a few times since late December, when former Congressman Collin Allred dropped out of the race, giving us barely two months of sparse data. And one out of the four polls of the Democratic race conducted in 2026 — accounting for 25% of the weight in the polling average — is a survey from the Crockett campaign. We have found that internal campaign polling tends to overshoot support for the campaign releasing the survey.
Partisan polling on the Republican side
Speaking of pollster partisanship, an even larger share of the polling of the Republican primary has been conducted for organizations backing one of the candidates. This is fairly common in primaries, but the degree here is fairly stark. Of the 10 surveys conducted in 2026, only three or four came from neutral sources (one of them, a Cygnal poll from early January, was conducted for an unspecified candidate in a different race, and we don’t know if that candidate has endorsed in the Senate race). Four more were conducted for pro-Cornyn organizations, and the other two for pro-Paxton organizations. Looking at the entire length of the campaign, of the 40 surveys that asked about all three major candidates, just 12 came from neutral sources.
And, perhaps unsurprisingly, the sponsor of the polls makes a difference in the results. In polls conducted on behalf of organizations supporting Paxton, Hunt has never polled higher than 18 points, and Cornyn’s support has diminished to the high 20s over time. In polls conducted for pro-Cornyn organizations, Cornyn’s support has never dipped below 28 points, and in the most recent poll, he remains in the mid-30s. And in pro-Hunt surveys, Hunt’s support grew to the mid 20s by the end of 2025. In the few neutral surveys we have, there’s a bit of a question mark: two show the race as nearly a 3-way tie, while the other two show Hunt in the teens.
We can read some tea leaves into these polls, though. While pro-Hunt polls showed him in the mid 20s in December, no pro-Hunt group has published a survey conducted in 2026, which may indicate that his support has started to peter out: no news is bad news, in a way. And in the most recent pro-Cornyn polling, Cornyn is tied with Paxton, which may indicate that the best survey result the Cornyn backers are able to get is not really all that good for the incumbent. But ultimately, polls conducted for organizations with a dog in the fight are known to be less reliable than neutral polls, so we may want to take the entire polling average with a grain of salt.
Crosstab uncertainty on the Democratic side
Given the temptation for people to use primary polling data to argue about which candidate might be more electable in a general election, another concerning source of uncertainty in this race is in the polling crosstabs. A survey from Emerson College conducted for Nexstar Media, for example, has James Talarico leading in the Democratic primary by 30 points among political independents, 56% to Crockett’s 27%. Meanwhile, a survey from the University of Houston found Crockett leading independents by 18 points. In Texas, voters can choose which party primary to participate in, so appealing to independent voters is key to winning.
That’s a 48-point swing between two polls on the same crosstab — and it illustrates why you should be extremely cautious about drawing electability inferences from primary polling subgroups. Part of the explanation here is subgroup estimates are based on very small sample sizes, which can be noisy. The University of Houston poll above has 550 likely democratic primary voters overall, for example, which means it probably contains fewer than 100 self-identified independents. The margin of error on vote share among a group of just 50 people is 14 percentage points — and that’s per candidate, meaning the margin of error on the margin between Crockett and Talarico is close to double that. And that’s before you even get into the fact that the two pollsters may have defined “independent” differently or made different assumptions about who’s actually going to cross over into the Democratic primary.
There’s also a deeper methodological problem lurking inside the crosstabs: in an open-primary state like Texas, the composition of each party’s primary electorate is itself uncertain. If a surge of independent — or even Republican — voters shows up to vote in the Democratic Party’s primary (something that early vote data may already be hinting at) then the crosstabs from pre-election polls, which were calibrated to a different assumed electorate, could be especially misleading. There isn’t just uncertainty about how independents will vote, there’s uncertainty about what types of independents are voting in which party’s primary, and whether that’s the same group that will turn out in November.
This kind of thing matters, because Democratic primary voters are often considering general election electability as a factor in their decision. But arguments that Talarico or Crockett is clearly the stronger general election candidate based on primary crosstabs just can’t be backed up by the data.
Polling primaries is just really hard
Part of covering public opinion polls is knowing when they are useful and when they are not. While polls give us good predictions of horse-race contests (especially presidential elections) on average, they are less predictive in primary elections.
This is in part because electoral dynamics can change quickly in primaries (candidates can drop out and endorse others), but also because primary polls are simply harder to conduct. Since the response rate to the average poll today is around 1%, pollsters rely on a statistical technique called weighting to make sure their poll is representative of the electorate by various demographic factors that are highly correlated with election outcomes, such as race, education, and party identification. But there are fewer highly predictive variables available to weight on in primary elections, where candidate support is more correlated with non-demographic factors like ideology, beliefs about issue prioritization and electability, etc.
Primary polls are also highly susceptible to decisions pollsters make about how to model who is likely to vote in each primary. For example, some pollsters base their turnout models on which voters turned out for previous primaries, while others ask voters directly if they plan to vote, but fail to sort out voting-aged adults who say they will vote, but are in fact very unlikely to. In races where vote intention is highly correlated with past participation — such as, for example, the 2025 New York City mayoral primary — these assumptions can also drive results (and errors). We’ve already seen a surge in turnout in the early vote in Texas, particularly on the Democratic side, which could be a warning sign for polls conducted with traditional, voter-file based turnout models.
In addition, primary polls tend to have significantly more undecided respondents than general election polls. In Texas Republican primary polls conducted in 2026, an average of 21 percent of respondents did not indicate which candidate they would vote for. These respondents may not be paying close attention to the race, but if they made it through the likely voter screen, there’s some indication, at least to the pollster, that they will vote. In some cases, respondents explicitly tell the pollster they plan to vote. In the Emerson College/Nexstar Media survey, for example, all the respondents told the pollsters they plan to vote next week, but only 71 percent expressed a preference for a candidate. How the remaining 29 percent of voters behave could mean the difference between who goes to a runoff, or if there is a runoff at all.
This all adds up to a lot of uncertainty about the polls ahead of next week’s elections. While your polling gurus at 50+1 are usually gung-ho about making inferences about politics with data, in this case, the empirical advice is actually to expect a lot of predictive error next week. Primary polls give us only a very rough sketch of these races. Paxton and Crockett technically “lead” in polls, but leads of 3 to 4 points are essentially coin flips given the historical accuracy of primary polls. The average 13 point error we see on polling margins means either race could produce a result that looks nothing like what the polls suggest. Don’t be surprised by a surprise.
Like this kind of analysis? 50+1 paid subscribers get premium deep dives like this one, plus sortable tables and complete data access on our polling website. If you want to follow the 2026 cycle with the best data at your fingertips, become a paid subscriber.
Footnotes
As of 7:00 AM Eastern Time, February 24, 2026
We chose these cycles because we had the most complete polling data available in these years
I think Talarico wins. He has the momentum. Even my mom, who last voted for a Democrat in 1996, says she is leaning towards him.