



Two weeks ago, President Donald Trump stood in front of a crowd of supporters at a first-of-its-kind midterms convention and beseeched the American people to “pretend I’m on the ballot.” Updated polling averages from FiftyPlusOne show he got what he asked for, but not in the way he wanted.
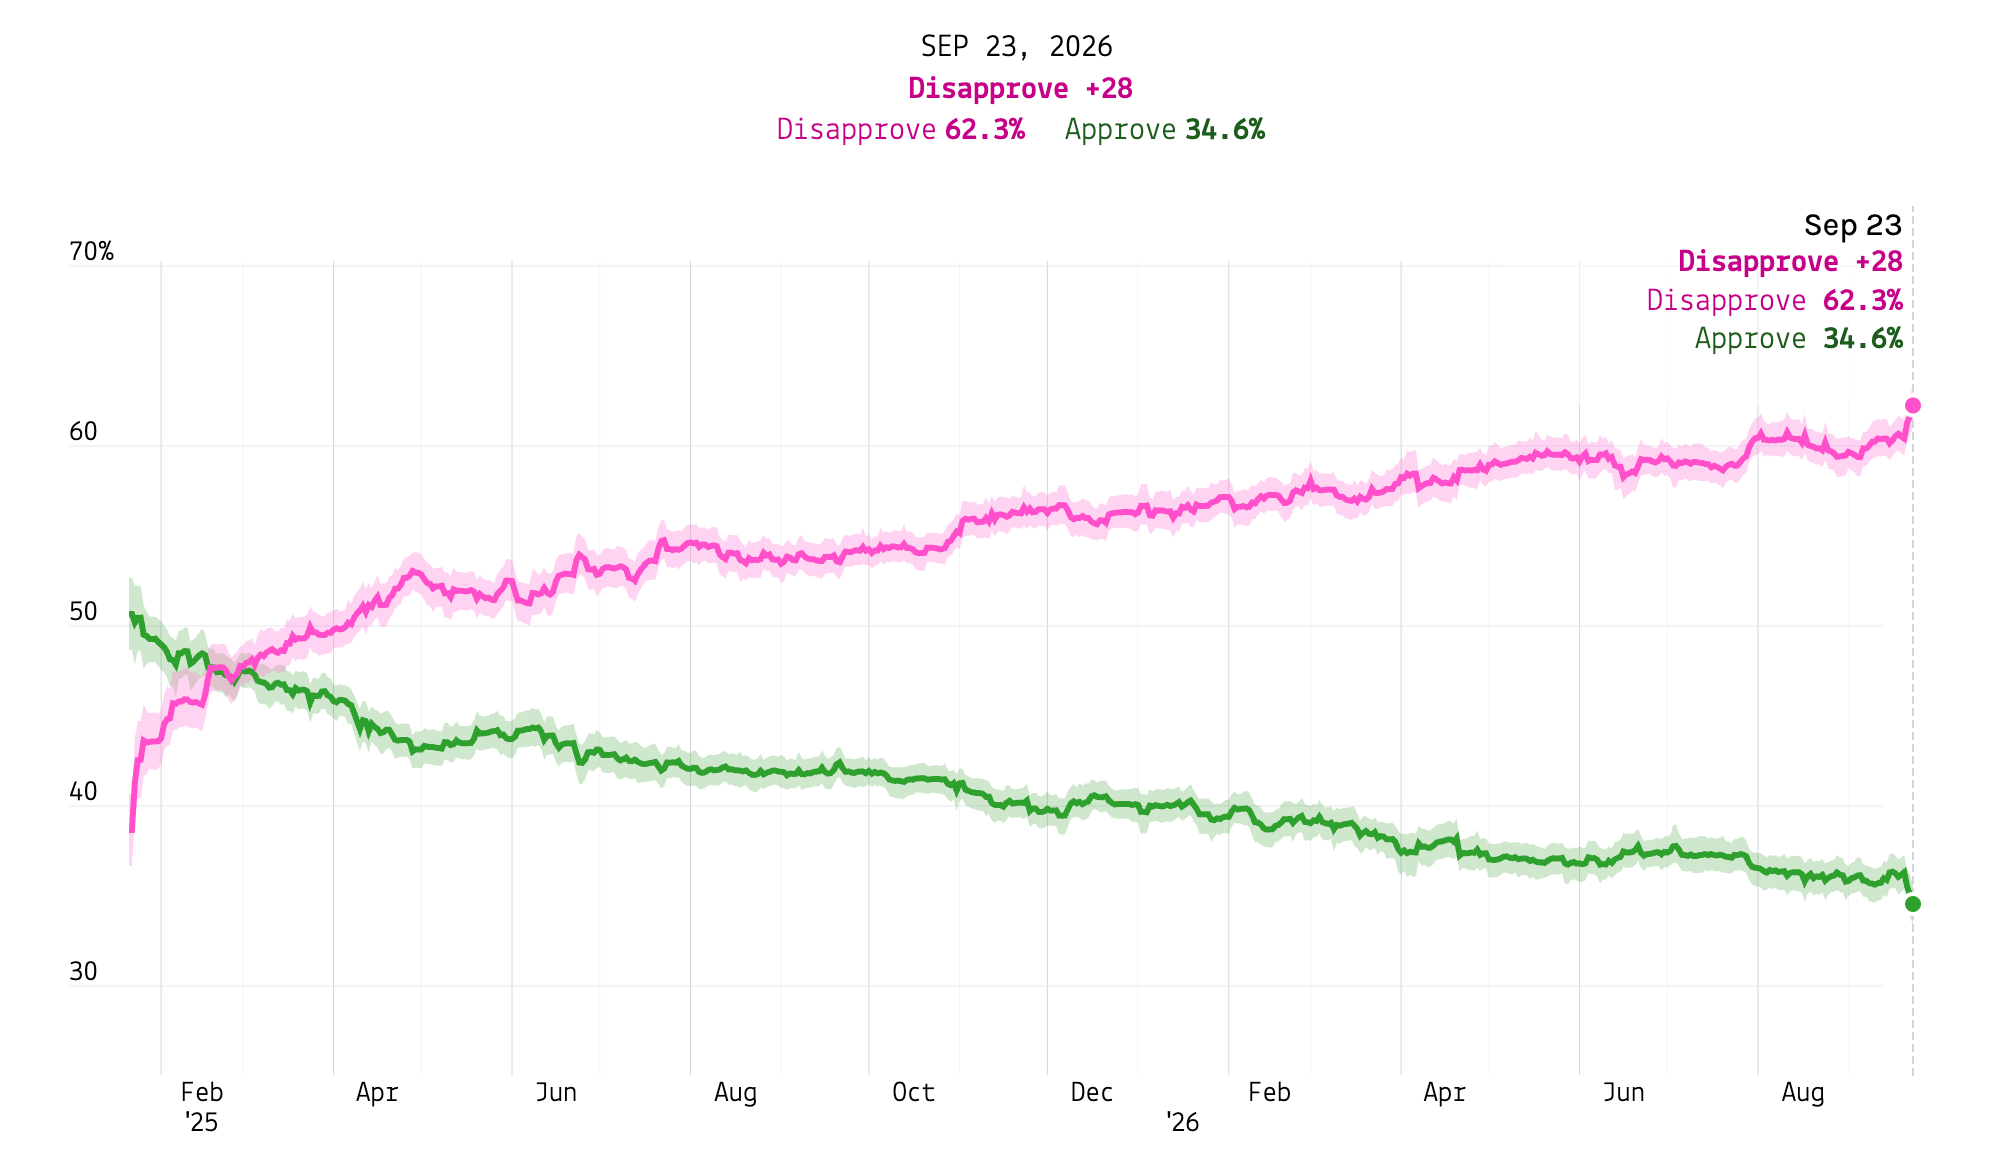
As of 11:00 AM on September 23, 2026, our average of polls gives the president a new low of 34.6% approval among U.S. adults, with a disapproval rating of 62.3%. Over the last week, he has hit new second-term lows in surveys from at least 7 polling firms: CNN/SSRS, Ipsos, NBC News, Strength In Numbers/Verasight, Quantus Insights, Echelon Insights, and American Research Group.
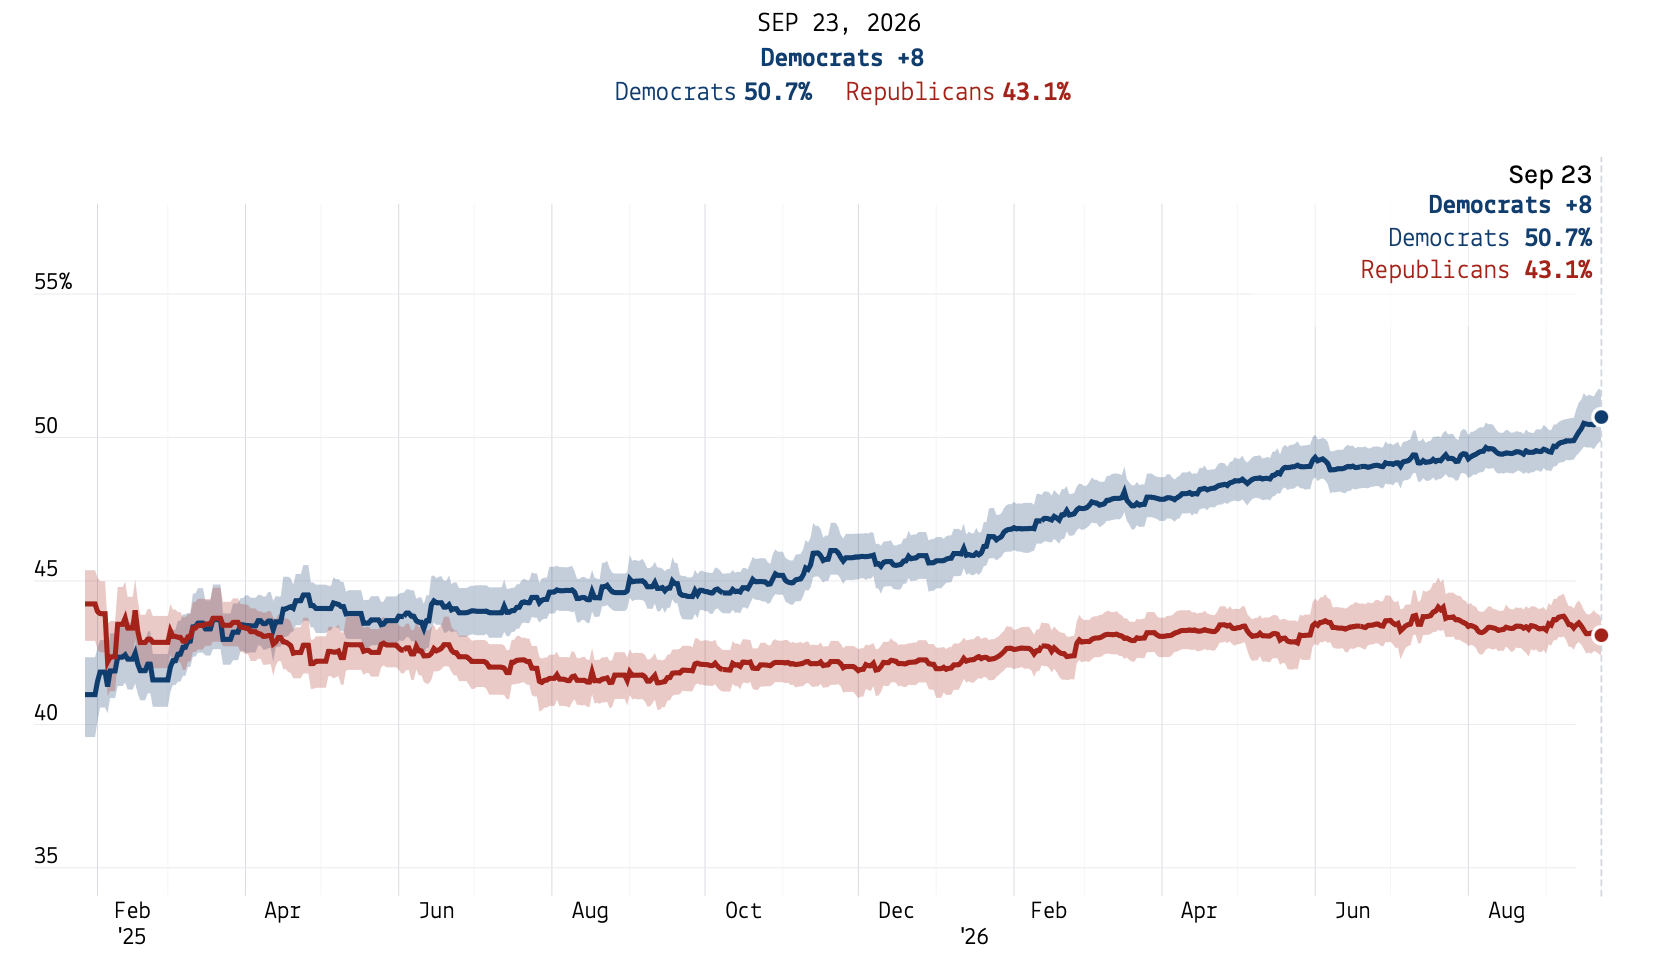
While the president has been sliding, the Republican Party’s deficit in the the U.S. House generic ballot has increased to 7.6 points, rounding to +8 points for the first time this cycle and rivaling the party’s lead in the 2018 blue wave:
Our historical polling averages show the president’s updated rating is worse than George W. Bush’s second-term approval rating on the eve of the 2006 midterm that cost Republicans both chambers of Congress. And public mood is approaching where it was toward Richard Nixon during Watergate, in the months before he resigned in disgrace.
Paid subscribers to 50+1 get access to premium analysis, plus sortable tables and complete data access on our polling website. If you want to follow the 2026 cycle with the best data at your fingertips, become a paid subscriber.
Trump 2 versus Trump 1
The cleanest way to see how much worse Trump’s ratings today are than for his first term is to put the two trends on top of each other, indexed to the first day of each term.
When expressed as a difference between approval and disapproval, President Trump’s current net approval of −28 (34.6% approve, 62.2% disapprove) is nearly double the deficit he was running at the same point in his first term, when net approval sat at −13 heading toward the 2018 wave that cost Republicans 41 House seats. The two lines tracked each other reasonably closely for the first year, with Trump actually slightly more popular the second time around, but diverged hard after the beginning of the U.S. war in Iran and in the summer of 2026. There has been a notable 3-point drop in the president’s net rating in the last two weeks:
Trump in historical context
Next, I look at Trump compared to past presidents at this point in their terms, both first and second. Trump’s problem, simply put, is that he is the most unpopular president ever to hold office at this point before a midterm election.
If we widen the comparison from 2017 to include every president’s first term back to Dwight Eisenhower in 1953 — 13 of them — the president sticks out like a sore thumb. (Harry Truman doesn’t belong in this group: he succeeded FDR unelected in 1945, so his own elected term, which began in 1949, is conventionally counted as his second term. He shows up in the next chart.) At the same point in their first terms, every single one of Trump’s predecessors was in better shape than he is right now. Carter, the name people usually reach for when they want an unpopular president, was within a point of break-even.
The averages in these charts were calculated by running the same computer program we use to estimate Trump’s average rating on historical polls, going back nearly nine decades.
Trump is serving a second, non-consecutive term, so the more direct comparison is to the eight other presidents who won a second term outright — FDR, Truman, Eisenhower, Nixon, Reagan, Clinton, Bush 43 and Obama — lined up by days since their second inauguration. Here, too, the president sticks out like a sore thumb. Reagan, Clinton and Eisenhower were all comfortably above water at this point in their second terms, and FDR, heading into the 1938 recession-driven wave that cost Democrats roughly 70 House seats, was still positive at +9. Truman, Obama and Bush were underwater, but only by 1, 12 and 14 points. The only second-term president who polled worse than Trump does today was Richard Nixon, and Nixon had already resigned five weeks before reaching this point in the calendar.
On average, presidents at this point in their second term have polled at a net approval of around +4 points (counting Nixon at his last day in office). Today, Trump is 28 points underwater — roughly a 32-point gap from the historical norm.
There are two lines worth emphasizing here. The first is George W. Bush’s, whose approval rating cratered in his second term under the weight of an unpopular war in Iraq. At this point in that term, September 2006, Bush’s net approval was −14. Six weeks later, voters gave Democrats the House and the Senate.
Today Trump’s approval rating is 13 points below where Bush was at this point in his second term, and 8 points below where he was on Election Day 2006. Bush didn’t sink to Trump’s current level until June 2007, more than half a year after his party had already been thrown out of power in Congress.
The second parallel is with Richard Nixon. Trump’s net approval today, −28, is roughly where Nixon’s stood in late November 1973: a month after the Saturday Night Massacre, with the Watergate investigation closing in, and eight months before he resigned in disgrace. Nixon bottomed out at −38 the week he left office. Trump is now about 10 points from Nixon’s Watergate-era low, and still falling.
What it means for November
Is Trump the single most unpopular president of the polling era, full stop? Not quite. Nixon’s final days in office were worse, and so were Bush’s last months in 2008, when the financial crisis pushed his net approval under −40. Harry Truman also had an approval rating in the 20s at his low point in March 1952, though his disapproval was barely higher than Trump’s is today, at 63%.
But among presidents who reached this specific point in a term before a midterm election, Trump has no equal. That’s true whether you compare him to his own first term, to every president’s first term since Eisenhower, or to the eight presidents who won a second term.
It’s also worth being clear about why Trump’s rating is this bad. Net approval of Trump on inflation and the cost of living — the single issue Americans name most often as the country’s biggest problem — has fallen to -45.6 in our average, the worst issue-specific number we’ve recorded for this presidency. And Trump has spent his presidency taking credit for inflationary policies, such as his tariffs and war in Iran.
The president has also moved policy dramatically to the right on immigration. While it remains his best issue, his net approval rating on immigration has fallen over 20 points since the start of his term, now sitting at -13. We know from political science that enacting policy more toward either political pole tends to cause voters to react harshly against the party in power.
Presidents’ parties almost always lose House seats in a midterm — it’s one of the most reliable patterns in American politics, going back generations, with only a couple of exceptions since the 1930s. The size of the loss has tended to track the president’s popularity: bigger when he’s unpopular, smaller when he’s popular.
Trump has made his popularity more central to voting decisions than usual this cycle, not less — by staging a midterm-year convention built entirely around himself, by asking voters to treat November as a referendum on him personally, and by dangling a $5,000 payout that only works if his party wins. He has made many decisions that directly tied the GOP’s fortunes to his own approval rating. That’s a risky gamble when you’re historically unpopular.
This is in large part why the FiftyPlusOne election forecast gives Democrats a 98% chance of winning back the House, and a 69% chance — better than two-in-three — of flipping the Senate this November.
There are plenty of local reasons Democrats are running well in individual seats — from recruitment, incumbency, fundraising, and other local political factors. But the biggest single explanation for the expected national wave is probably the simplest one: the president is historically unpopular. Maybe it really is that simple.
Paid subscribers to 50+1 get access to premium analysis, plus sortable tables and complete data access on our polling website. If you want to follow the 2026 cycle with the best data at your fingertips, become a paid subscriber.
Thanks.
Elliott: The current FiftyPlusOne Senate forecast says the median outcome is Dems with 52 seats and a D+4 seats? How are both of those possible? Shouldn't it be D+5?